Unambiguous Characterization of Coronal Structures via Wavelet Packets Technique
10 likes | 120 Vues
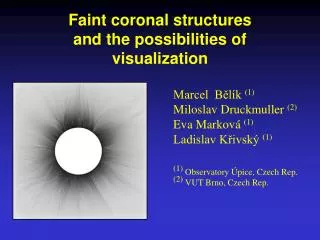
This study introduces a novel technique leveraging wavelet packets equalization to enhance the characterization of coronal features observed by LASCO. By applying this multi-resolution image processing method, we successfully improve visibility and detail of faint and diffuse structures in coronal images. The technique enables accurate tracking of motion and dynamics, addressing challenges in capturing coronal mass ejections (CMEs) and outflows. We demonstrate this method's efficacy using specific events captured in LASCO/C2 images, allowing for precise determination of kinematic parameters such as speed and angular extent.

Unambiguous Characterization of Coronal Structures via Wavelet Packets Technique
E N D
Presentation Transcript
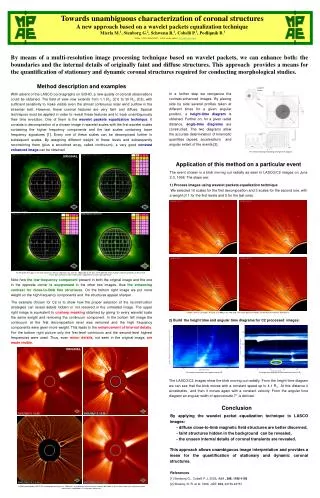
LASCO images PA Towards unambiguous characterization of coronal structures A new approach based on a wavelet packets equalization technique Mierla M.1, Stenborg G.2, Schwenn R.1, Cobelli P.3, Podlipnik B.1 1.MPAe, 2.CUA / NASA GSFC , 3.UBA, contact address mierla@linmpi.mpg.de time m R I PA time time R The sketch showing the building of height time diagram 1998/06/02 23:28 UT 1998/06/02 23:56 UT Fe XIV green line loops in the inner corona as seen by LASCO/C1 on June 01, 1998 at 04:12 UT plus three different reconstruction schemes based on an 8 first-level scales plus continuum, each scale further subdivided in 4 scales plus continuum PA = 40º R = 3.00 R⊙ PA = 40º R = 2.85 R⊙ 1998/06/03 00:28UT 1998/06/03 00:58 UT PA = 40º R = 3.30 R⊙ PA = 40º R = 3.70 R⊙ Outflow, seen in C2 images, on June, 2-3 1998 on the NW limb. The arrows point to the blob, and the blue dashed lines delimitate it. 20 30 Time [in hours] The height-time diagram for a polar angle of 40º The angle-time diagram for the radial distance of 3 R⊙ A CME observed by LASCO-C2 coronagraph on August 13, 2002 plus three different reconstruction schemes based on an 8 first-level scales plus continuum, each scale further subdivided in 3 scales plus continuum. By means of a multi-resolution image processing technique based on wavelet packets, we can enhance both: the boundaries and the internal details of originally faint and diffuse structures. This approach provides a means for the quantification of stationary and dynamic coronal structures required for conducting morphological studies. Method description and examples With advent of the LASCO coronagraphs on SOHO, a new quality of coronal observations could be obtained. The field of view now extends from 1.1 R⊙ (C1) to 30 R⊙ (C3), with sufficient sensitivity to make visible even the almost continuous solar wind outflow in the streamer belt. However, these coronal features are very faint and diffuse. Special techniques must be applied in order to reveal these features and to track unambiguously their time evolution. One of them is the wavelet packets equalization technique. It consists in decomposition of a chosen image in wavelet scales with the first wavelet scales containing the higher frequency components and the last scales containing lower frequency signatures [1]. Every one of these scales can be decomposed further in subsequent scales. By assigning different weight to these levels and subsequently recombining them (plus a smoothed array, called continuum), a very good contrast enhanced image can be obtained. In a further step we reorganize the contrast-enhanced images. By placing side by side several profiles taken at different times for a given angular position, a height-time diagram is obtained. Further on, for a given radial distance, angle-time diagrams are constructed. The two diagrams allow the accurate determination of kinematic quantities (speed, acceleration) and angular extent of the events [2]. ORIGINAL Application of this method on a particular event The event chosen is a blob moving out radially as seen in LASCO/C2 images on June 2-3, 1998. The steps are: 1) Process images using wavelet packets equalization technique We selected 10 scales for the first decomposition and 3 scales for the second one, with a weight of 1 for the first levels and 5 for the last ones. Note how the low frequency component present in both the original image and the one in the opposite corner is suppressed in the other two images, thus the enhancing contrast for close-to-limb fine structures. On the bottom right image we put more weight on the high frequency components and the structures appear sharper . The example chosen for C2 is to show how the proper selection of the reconstruction strategies can reveal details hidden or not resolved in the untreated image. The upper right image is equivalent to unsharp masking obtained by giving to every wavelet scale the same weight and removing the continuum component. In the bottom left image the continuum at the first decomposition level was removed and the high frequency components were given more weight. This leads to the enhancement of internal details. For the bottom right picture only the first-level continuum and the second-level highest frequencies were used. Thus, even minor details, not seen in the original image,are made visible. 2) Build the height time and angular time diagrams for C2 processed images: ORIGINAL 4.1 R⊙ 4.1 R⊙ The LASCO/C2 images show the blob moving out radially. From the height time diagram we can see that the blob moves with a constant speed up to 4.1 R⊙. At this distance it accelerates and then it moves again with a constant velocity. From the angular time diagram an angular width of approximate 7º is derived. Conclusion By applying the wavelet packet equalization technique to LASCO images: - diffuse close-to-limb magnetic field structures are better discerned, - faint structures hidden in the background can be revealed, - the unseen internal details of coronal transients are revealed. This approach allows unambiguous image interpretation and provides a mean for the quantification of stationary and dynamic coronal structures. References [1]Stenborg G., Cobelli P. J. 2003, A&A , 398, 1185-1193 [2] Sheeley, N. R. et al. 1999, JGR, 104, 24739-24767