Effective Beef Cattle Breeding Selection Programs
Learn about guidelines, heritability traits, correlation, response to selection, generation intervals, testing methods, and reproductive data for optimal cattle breeding.

Effective Beef Cattle Breeding Selection Programs
E N D
Presentation Transcript
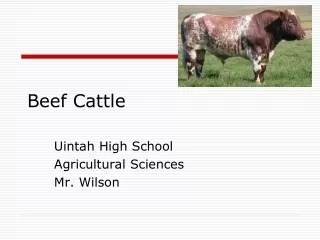
Beef Cattle BreedingSelection Programs David Buchanan, Professor Department of Animal Science Presented by: Brian Freking LeFlore County Extension Educator
Beef Cattle Breeding • Beef Improvement Federation started in 1968 • Organization of people involved in performance testing for beef cattle • “Guidelines for Uniform Beef Improvement Programs” http://www.beefimprovement.org/
Inheritance of Quantitative Traits • P = G + E • Phenotype = Genotype + Environment • Genotype • Additive – due to individual genes • Non-additive – due to combinations of genes
Variation in a Herd Vp = Va + Vna + Ve Additive variation Non-additive variation Environmental variation 525 500
Heritability • = • Define - proportion of phenotypic • variation that is due to • additive gene effects
Heritability Traits h2 Magnitude Reproductive < .2 Low Growth .2-.4 Moderate Carcass .4-.6 High Few traits have h2 > .6
Heritability Estimates for Beef Cattle Trait h2 Birth weight 0.35 Weaning weight 0.30 Feedlot gain 0.45 Fat thickness 0.33 Rib eye area 0.58 Marbling 0.42 Calving interval 0.08 Conception rate 0.05 Milk 0.20 Scrotal Circumference 0.50 Yearling weight 0.40 Feed efficiency 0.38 Tenderness 0.55 Source: Cundiff, L.V. and K.E. Gregory; Lasley, J.F.; Taylor, R.E.
Heritability • Proportion of the superiority in an individual which can be passed on to the offspring. • Proportion of the differences in individuals which is due to genetics (additive). • Only the additive component since a sperm or egg has individual genes, not gene combinations.
Phenotypic Correlation Association between actual performance for two traits Genetic Correlation Association between genetic merit for two traits
Genetic Correlation If traits have a non-zero genetic correlation selection for one trait, yields change in the other trait.
Phenotypic Correlation Beef cattle BW WW ADG FAT REA Birth weight .351 .46 .01 Weaning weight .42 .30 .46 .04 .74 Genetic Feedlot gain .12 .20 .45 -.05 .49 Corr. Fat thickness .01 .18 .33 -.10 Rib eye area .08 .20 -.30 .58 1 Diagonals are heritability estimates Example: selection for increased ADG increased WW (also improved FE)
Response to Selection • R = h2 x S • Where: • R is the response • h2 is the heritability • S is the selection differential • Selection differential: • Difference between individuals selected to be parents and the average of the entire herd
Generation Interval • Average time to replace a parent in population • Average age of parents when offspring are born • NOT average age when first offspring are born • 3-4 years – bulls 4.5-6 years – cows
Response per year • = Response per gen / gen int • How to increase response: • Increase selection differential • Reduce generation interval
BIF Adjustment Factors • Need to make fair comparisons • Corrects for known sources of environmental variation • Age of dam • Age of individual
Adjustment Factors • Reduce environmental variance • Increase heritability • Increase response to selection
On-farm Testing • All producers should have a program of • identifying superior breeding stock. • Uniform management enables identification • of superior breeding stock increases • effective heritability.
Central Test Stations • Bulls from different herds evaluated for • post weaning performance • Locate and recognize superior bulls • evaluate breeding stock from • producers demonstrate effective • testing practices.
Whole Herd Reporting • Compared to traditional reporting of • individual animals, whole herd reporting • enables understanding of when cows do • or do not have calves. • Producer submits a “breeding herd • inventory”.
Female Production Data • Breeding dates • Pregnancy status - between 50 and 150 days • Calving date • Dystocia score • 1-No difficulty 2-Some assist • 3-Mechanical assist 4-Surgery • 5-Abnormal presentation
Male Reproduction Data • History and physical exam • Injury or abnormality • Evaluation of scrotum and testes • Palpation of internal accessory glands • Exam of the penis • Scrotal circumference • Sperm motility
Sire and Herd Reproduction • Number of cows exposed • Percent palpated pregnant • cows pregnant / cows exposed • Live calving percent • live calves / (cows exposed • – cows sold or died • + cows purchased) • Weaning percent • live calves / (cows exposed • – cows sold or died • + cows purchased)
Growth Rate and Efficiency of Gain • Birth weight – indicator of calving difficulty • obtained within 24 hours • Weaning weight – measure of both growth and mothering ability • Yearling weight – measure of growth • 365 days – feedlot management • 452 days • 550 days – pasture management
BIF Standard Adjustment Factors for Birth Weight Age of Dam Factor 2 +8 3 +5 4 +2 5-10 0 >10 +3 Birth weight ratio = adj.BWi x 100 adj.χBWg
Weaning Weight • 205-day weight • = x 205 + BW • Add the age of dam adjustment to get • adjusted 205-day weight.
Standard Adjustment Factors for Weaning Weight Adjustment Factors Age of Dam Male Calves Female Calves 2 +60 +54 3 +40 +36 4 +20 +18 5-10 0 0 >10 +20 +18
Postweaning Feed Efficiency. • Critically important trait • Difficult to measure • requires individual feed intake • Selection for rapid growth • improved feed efficiency • also increased mature size
Carcass Evaluation • Product quality • Prime • Choice • Select • Standard • Marbling • Major determinant of quality • Color • Firmness • Texture • Maturity
Carcass Evaluation • Yield grade • Fat thickness • KPH fat • Hot carcass weight • Rib eye area
Live Animal Evaluation • Measurements and subjective evaluations • Frame size • Classification system for hip heights • Scrotal circumference • Indicator of sperm production and age at puberty • Pelvic area • Predictor of calving difficulty
National Cattle Evaluation • Goal – compare cattle from different • herds • Conducted by breed associations • Depends on use of AI to make comparisons between herds .
Use of a Reference Sire to Compare Between Herds • Herd 1 Herd 2 Herd 3 • Reference sire Bull A Bull A Bull A • Avg. calf weight 450 500 550 • Home sire Bull 1 Bull 2 Bull 3 • Avg. calf weight 460 480 500 • Rank 1 (+10) 2 (-20) 3 (-50)
Estimated Breeding Value • Actual genetic merit never known • Estimate breeding value based upon: • Individual performance • Performance of relatives • Parents, sibs, progeny etc.
EPD - Expected Progeny Difference • = 1/2 of Estimated Breeding Value • merit of an animal, in comparison with others • Bull 1 Bull 2 • EBV = 20 EBV = 0 • EPD = 10 EPD = 0 • Calves expected to differ by • 10 pounds • EPDs used to compare animals
Accuracy • Measure of confidence in an estimate of breeding value • Range of possible values 0 to 1 2005 SAF Directive AAA 13574137 2007 Feel more confident With higher values
Accuracy and Possible Change • Accuracy is a correlation(between true breeding value and estimated breeding value). • (0 to 1) • Possible change is a standard deviation • gives a 68% confidence interval. • Best possible change would be 0. .
10+ Year Change Fall 1996 Sire Summary Spring 2007 Sire Summary
Base Point in Angus 0 is average in 1979 Angus EPDs are deviations from 1979 mean.
Use of EPDs • Purebred herds • Use a balance of traits • Be aware of needs of commercial customers • Provide good data to breed association
Use of EPDs ― Commercial Herds Recommendations for EPD for Various Commercial Scenarios Use of Individual Birth Weaning Yearling Milk Terminal sire on mature cows Not too high High High Not relevant Bull to use with heifers Low Moderate Moderate Mod – high Sire replacement heifers Low – mod Mod – high Mod- high Mod - high
Inbreeding • Mating of related individuals • Mating of individuals more • closely related than the • average of the breed • Animal is inbred if, and only if, its parents are related.
Measurement of Inbreeding • Inbreeding coefficient (F) • % increase in homozygocity above • the average of the breed • If F = .25, the animal is 25% more • homozygous than the average of the breed
Inbreeding Coefficient (F) • Minimum value = 0 Maximum value = 1 • Mating half sibs F = .125 • Mating full sibs or parent-offspring F = .25 • For livestock • rare for F > .6 • Lab animals • F can approach .9 • .
Phenotypic Result of Inbreeding • Inbreeding depression • Decline in performance from mating • related individuals.
Phenotypic Result of Inbreeding • Inbreeding depression • More pronounced for lowly • heritable traits • Class of Trait Inbreeding Depression • Reproduction High • Growth Moderate • Carcass Low
Effects of Inbreeding • Does not cause mutations • More homozygotes • Recessive homozygotes tend to be inferior • Large loss in reproduction and livability • Some loss in growth and efficiency • Little loss in carcass merit .
Linebreeding • Pedigrees constructed so that • F < .1 • high relationship to a single common ancestor • single common ancestor • appears several times > 3 generations back
Good Example of Linebreeding (Example is a Horse) F < .05 RH10,IM > .25 Mambino Abdallah Son of Messinger Amazonia Imp. Messinger Hambletonion10 Bellfounder Bishop’s Hambletonion Charles Kent Mare One Eye Silver Tail single common ancestor