Download
1 / 43
430 likes | 452 Vues
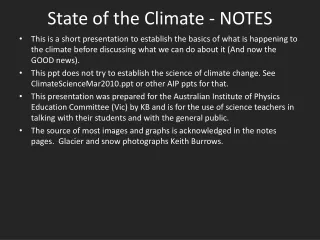
State of the Climate - NOTES. This is a short presentation to establish the basics of what is happening to the climate before discussing what we can do about it (And now the GOOD news).

E N D
State of the Climate - NOTES • This is a short presentation to establish the basics of what is happening to the climate before discussing what we can do about it (And now the GOOD news). • This ppt does not try to establish the science of climate change. See ClimateScienceMar2010.ppt or other AIP ppts for that. • This presentation was prepared for the Australian Institute of Physics Education Committee (Vic) by KB and is for the use of science teachers in talking with their students and with the general public. • The source of most images and graphs is acknowledged in the notes pages. Glacier and snow photographs Keith Burrows.
“State of the Climate” What are the scientists telling us?
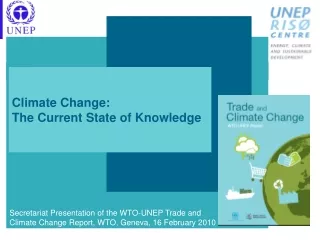
Many scientific organisations have produced reports in an attempt to get people to listen
“State of the Climate” • Temperatures going up (air, land, sea) • Humidity increasing • Ocean heat content increasing • Sea level rising • Snow cover decreasing • Glaciers melting • Sea-ice melting
Title • text
Title • text
Title • text 0.2oC 0.6oC = 0.015oC per yr 40 yrs
Lord Christopher Monckton of Brenchley’s version of temperature trends
Title • Let’s put Monckton’s red line on the NASA graph
Title • BUT: 1000 people gave Monckton a standing ovation in the Sofitel last February! 998 X
Title • Prof Ian Plimer introduced Monckton (The one ‘scientist’ a certain politician listens to!) Monckton spreads his message with the help of radio talk-back
Title • From “State of the Climate in 2009”
Title • text
Title • text So this is where we should look to see if the Earth is warming!
Title • text
This is how the deniers deal with this data! • text 4 years !
But there is a little problem – missing heat! • Current measurements don’t account for all the net heat absorbed by the Earth • (Radiation in minus radiation out) National Center for Atmospheric Research (NCAR)
Ocean heat content is the most reliable indicator of global warming • ...but also the least obvious! • However, it is the underlying cause of ... • rising sea levels • higher air temperatures • increased ‘extreme events’ • changed rainfall patterns • melting sea ice
Pakistan August 2010 1600 dead 20 million washed from their homes One fifth of the country under water Loss of property catastrophic Economy shattered
Pakistan August 2010 The Indus valley August 2009 and August 2010
Pakistan August 2010 • United Nations Office for the Coordination of Humanitarian Affairs stated that the scale of destruction from Pakistan's monsoon flooding in July and August of 2010 surpassed the devastation from the 2004 Indian Ocean tsunami, the 2005 northern Pakistan earthquake, and the 2010 Haiti earthquake combined.
Russia August 2010 In Russia, firefighters and soldiers were battling to stop wildfires from engulfing key nuclear sites ... Morgues in Moscow are overflowing as officials estimate 5000 have died in the worst heatwave in 130 years.
Sub-Saharan Africa • Lagos — More than ten million people across West Africa are facing severe hunger and malnutrition because of drought, poor harvests and rising food prices • Worsening conditions in the Sahel region of West Africa have seen malnutrition rates soar as families struggle to find enough food to eat • Niger - the world's least developed country - more than seven million people, almost half the population, facing food insecurity; 3.3 million, approaching a quarter of the population, are severely food insecure. • Another two million people in Chad, more than 600,000 in Mali and more than 300,000 in Mauritania are at risk.
Is it climate change? • “There's no doubt that clearly the climate change is a major contributing factor,” said Dr Ghassem Asrar, director of the World Climate Research Program and the World Meteorological Organisation (WMO). • Scientists are usually more comfortable with trends and prognostications than with cause and effect; most would never ascribe a single weather event to climate change. Which makes Asrar's declarations and similar ones from other experts all the more remarkable. The Age 21 August 2010
Unfortunately it’s not just the Arctic • The Wilkins Ice Shelf
The collapse of the Wilkins Ice shelf Feb 28 to March 82008(Approx 50 km long)