Download
1 / 43
430 likes | 445 Vues
This core course explores the process of modeling and understanding confidence. Topics include formulating purpose, identifying entities and relations, formalizing models, and interpreting and presenting results. Week 6 focuses on models and confidence, discussing validation, verification, accuracy, precision, and assessing confidence in black box and glass box models.

E N D
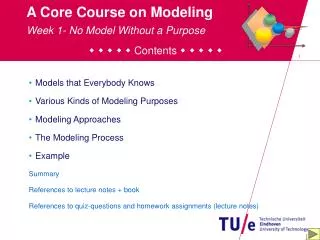
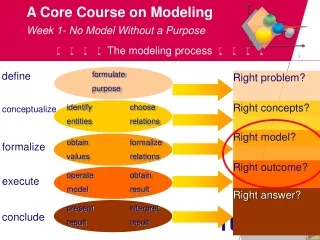
define Right concepts? Right problem? conceptualize Right model? formalize Right outcome? execute Right answer? conclude A Core Course on Modeling Week 1- No Model Without a Purpose The modeling process 1 formulate purpose identify entities choose relations obtain values formalize relations operate model obtain result present result interpret result
A Core Course on Modeling Week 6-Models and Confidence Contents • What do we mean by Confidence? • Validation and Verification, Accuracy and Precision • Distributions to Indicate Uncertainty • Distance and Similarity • Confidence in Black Box models • Features from Data Sets • Example of the Value of a Black Box Model • Validating a Black Box Model • Confidence in Glass Box Models • Structural Validity Assessment • Quantitative Validity Assessment • Summary • References to lecture notes + book • References to quiz-questions and homework assignments (lecture notes)
A Core Course on Modeling Week 6-Models and Confidence What do we mean by Confidence? 3 ‘96% of the contents of the universe is unknown dark matter + energy’ so: ‘we can’t have confidence in cosmological models’ blueberry marmalade?
A Core Course on Modeling Week 6-Models and Confidence What do we mean by Confidence? 4 Not quite: confidence only assessible when • modeled system • model • modeling purpose are all known modeled system model represented by needs needs confidence should fulfill with respect to needs purpose
A Core Course on Modeling Week 6-Models and Confidence What do we mean by Confidence? 5 example 1: elegant and simple model (elementary secondary school physics, say mechanics of levers and slides) modeled systems: not explicitly defined purpose: to pass one’s exam
A Core Course on Modeling Week 6-Models and Confidence What do we mean by Confidence? 6 example 1: elegant and simple model (elementary secondary school physics, say mechanics of levers and slides) modeled systems: ship yard purpose: to secure safe launch
A Core Course on Modeling Week 6-Models and Confidence What do we mean by Confidence? 7 example 1: elegant and simple model (elementary secondary school physics, say mechanics of levers and slides) modeled systems: ship yard purpose: to find direction of moving ship (uphill or downhill?)
A Core Course on Modeling Week 6-Models and Confidence What do we mean by Confidence? 8 example 2: model: full event log modeled systems: Internet traffic purpose: diagnose performance bottlenecks
A Core Course on Modeling Week 6-Models and Confidence What do we mean by Confidence? 9 example 2: model: full event log modeled systems: Internet traffic purpose: document for archiving
A Core Course on Modeling Week 6-Models and Confidence What do we mean by Confidence? 10 example 2: model: aggregated data modeled systems: Internet traffic purpose: document for archiving
A Core Course on Modeling Week 6-Models and Confidence What do we mean by Confidence? 11 example 2: model: aggregated data modeled systems: Internet traffic purpose: analyse performance bottlenecks
A Core Course on Modeling Week 6-Models and Confidence Validation and Verification, Accuracy and Precision 12 Terms in the literature to discuss confidence: Validation: is it the right model? • consistency model - modeled system • e.g. are cat.-III values correct? • does the model behave intuitively? • consistency model - purpose • e.g. are cat.-II values conclusive? ‘Valides’: strength
A Core Course on Modeling Week 6-Models and Confidence Validation and Verification, Accuracy and Precision 13 Terms in the literature to discuss confidence: Validation: is it the right model? • consistency model - modeled system • e.g. are cat.-III values correct? • does the model behave intuitively? • consistency model - purpose • e.g. are cat.-II values conclusive? verification: is the model right? • consistency conceptual - formal model • e.g. are dimensions correct? • is the graph a-cyclic? • are values within admitted bounds cf. types? ‘Veritas’: truth
A Core Course on Modeling Week 6-Models and Confidence Validation and Verification, Accuracy and Precision 14 Terms in the literature to discuss confidence: modeled system model conceptual & formal represented by Validation: is it the right model? • consistency model - modeled system • e.g. are cat.-III values correct? • does the model behave intuitively? • consistency model - purpose • e.g. are cat.-II values conclusive? needs needs confidence should fulfill with respect to needs purpose verification: is the model right? • consistency conceptual - formal model • e.g. are dimensions correct? • is the graph a-cyclic? • are values within admitted bounds cf. types?
A Core Course on Modeling Week 6-Models and Confidence Validation and Verification, Accuracy and Precision 15 Terms in the literature to discuss confidence: validation verification accuracy precision … based on
A Core Course on Modeling Week 6-Models and Confidence Validation and Verification, Accuracy and Precision 16 Terms in the literature to discuss confidence: validation verification accuracy precision ? ? high accuracylowprecision low accuracyhighprecision low bias (offset, systematic error), large spreading low spreading (noise, randomness), large bias a single result gives no information: look at ensembles ? ? low accuracylowprecision high accuracyhighprecision …can only be assessed with ground truth large spreading, large bias low spreading, low bias …assessment needs no ground truth (reproducibility) outlier (freak accident, miracle, …)
A Core Course on Modeling Week 6-Models and Confidence Distributions to Indicate Uncertainty 17 Terms in the literature to discuss confidence: validation verification accuracy precision these all lead to uncertainty, represented as a distribution giving the chance(density) of a particular but uncertain outcome with some average and some spreading. distribution …
A Core Course on Modeling Week 6-Models and Confidence Distributions to Indicate Uncertainty 18 Terms in the literature to discuss confidence: validation verification accuracy precision these all lead to uncertainty, represented as a distribution giving the chance(density) of a particular but uncertain outcome with some average and some spreading. Gaussian (normal) distribution: the sum of sufficiently many uncorrelated numbers with average and spreading has a normal distribution. E.g.: de weight distribution of 18-year old Americans.
A Core Course on Modeling Week 6-Models and Confidence Distributions to Indicate Uncertainty 19 Terms in the literature to discuss confidence: validation verification accuracy precision these all lead to uncertainty, represented as a distribution giving the chance(density) of a particular but uncertain outcome with some average and some spreading Uniform distribution: all outcomes in an interval between - and + have equal probability (e.g., dice: =3.5, =2.5). Distributions can be continuous (measuring) or discrete (counting, e.g. dice)
A Core Course on Modeling Week 6-Models and Confidence Distributions to Indicate Uncertainty 20 Uncertain model outcome and purpose: Example 1. model used for verification (e.g., diagnosis; classification ‘good’ or ‘bad’. high confidence medium confidence low confidence Confidence for diagnosis support. Compare model outcome against threshold. Confidence is lower if areas left and right from treshold are less different. Validation: is the treshhold at the right place? Does checking with this treshhold mean anything w.r.t. the purpose? Verification (for glass box): do we calculate the distribution correctly? Accuracy: are we sure there is no bias? Precision: can we obtain narrower distributions?
A Core Course on Modeling Week 6-Models and Confidence Distributions to Indicate Uncertainty 21 Uncertain model outcome and purpose: Example 2. model used in design: computed uncertainty intervals should be small enough to assess if A or B is better. high confidence medium confidence low confidence A A A B A A Confidence for design decision support: compare one model outcome against a second model outcome. Confidence is lower if the areas of two distributions have larger overlap.
A Core Course on Modeling Week 6-Models and Confidence Confidence in black box models 22 Black box models have empirical data as input. Quantities try to capture essential behavior of this data. Quantities typically involve aggregarion. Most common aggregations: average, standard deviation, correlation, fit. The black box in aircraft, although colored orange for easier retrieval, is very much a black box model – in the sense that it only takes in data. Confidence is black boxes is essential, e.g. to reconstruct or diagnose the occurrences during an incident. univariate: every item is a single quantity bivariate: every item is a pair of quantities
A Core Course on Modeling Week 6-Models and Confidence Features from Data Sets 23 Average: What is the central tendency in a set? (mathematical details: see datamodelling or statistics courses) ‘Averages’ can be computed for all sorts of sets – provided that the properties of the elements allow averaging. The ‘average’ face is an important concept in automated face recognition.
A Core Course on Modeling Week 6-Models and Confidence Features from Data Sets 24 Standard deviation (; variance is 2): How closely packed is a set? (mathematical details: see datamodelling or statistics courses) Standard deviation is a measure for the amount of variation in a set of values.
A Core Course on Modeling Week 6-Models and Confidence Features from Data Sets 25 Correlation (): What is the agreement between two sets (=a measure for similarity)? (mathematical details: see data modeling or statistics courses) ‘Correlation’ is a form of similarity. An interesting case is self-similarity: sometimes an object is similar to a scaled and perhaps transformed copy of itself. Mathematical objects called fractals are self-similar, but also some natural objects (Romanesco broccoli ) classify as (nearly) self similar.
A Core Course on Modeling Week 6-Models and Confidence Example of the Value of a Black Box Model 26 fit: example of a extracting meaningful pattern from data: Example: data set: (xi,yi), assume linear dependency y=f(x). Intuition: find a line y=ax+b such that the sum of squares of the vertical differences is minimal (mathematical details: see data modeling or statistics courses). Patterns in data are often more valuable than the unprocessed data. Hence the name ‘data mining’ for extracting this value. …very bad …still not good …try again …good (best?)
A Core Course on Modeling Week 6-Models and Confidence Validating a Black Box Model 27 A black box model should explain the essence of a body of data. Subtracting the explained part of the data should leave little of the initial data. For data (xi,yi), ‘explained’ by a model y=f(x), the part left over is (yi-f(xi))2. This should be small compared to (yi-y)2 (=what you would get assuming no functional dependency). Therefore: confidence is high iff (yi-f(xi))2/ (yi-y)2 is <<1. Residue literally means ‘left over’. To assess confidence of a black box model, one should check if there is not too much unexplained information left in the initial data.
A Core Course on Modeling Week 6-Models and Confidence Validating a Black Box Model 28 A black box model should be distinctive, that is: it should allow to distinguish input sets that intuitively are distinct. Average, variance and least squares may not be as distinctive as you would like. Anscombe (1973) constructed 4 very distinct data sets with equal average, variance and least square fits. Early conclusion: ‘these sets are similar’.
A Core Course on Modeling Week 6-Models and Confidence Validating a Black Box Model 29 • Raw data is reasonably well explained by lin. least squares fit (low residue). So what? • Challenge hypothesis that raw data stems from one set. Cluster analysis reveals two sets. • Conclusion 1: women will overtake men in 2050 ? • Conclusion 2: men will break 0 second record around 2120 ? Get even lower residuals with 4 clusters, taking ‘Jamaica or not Jamaica’ into account. Should Olympic Games have Jamaican athletes in a seperate category or not? What are the criteria for justifiable segregation? (categories in paralympics!) What are the assumptions on which this conclusion is based? Seek an argument from probabilities, calculating error distributions of the coordinates of the intersection point This is impossible for physical reasons. But not all black box models involve physics.
A Core Course on Modeling Week 6-Models and Confidence Confidence in Glass Box Models 30 Glass box models computes values for output variables in dependence on input variables. Claim: for every purpose, defined in terms of output variabels, fulfilling the purpose amounts to the uncertainty distribution on the output variables to be sufficiently narrow. We have seen an example on this sheet. The value, produced by a glass box (model), can be assessed via its output variables: these should have sufficiently narrow uncertainty intervals (given the purpose!).
A Core Course on Modeling Week 6-Models and Confidence Structural Validity Assessment 31 Qualitative validation (structural confidence) 1: examine dependencies in the functional network The value, produced by a glass box (model), can be assessed via its output variables: these should have sufficiently narrow uncertainty intervals.
A Core Course on Modeling Week 6-Models and Confidence Structural Validity Assessment 32 Qualitative validation (structural confidence) 1: examine dependencies in the functional network expected output calculated input input output The value, produced by a glass box (model), can be assessed via its output variables: these should have sufficiently narrow uncertainty intervals. select any pair of variables, and graphically compare their dependency with what you expect, tests the dependencies in between …
A Core Course on Modeling Week 6-Models and Confidence Structural Validity Assessment 33 Qualitative validation (structural confidence) 1: examine dependencies in the functional network expected output calculated input output The value, produced by a glass box (model), can be assessed via its output variables: these should have sufficiently narrow ncertainty intervals. input … even if they involve multiple parallel dependency routes …
A Core Course on Modeling Week 6-Models and Confidence Structural Validity Assessment 34 Qualitative validation (structural confidence) 1: examine dependencies in the functional network output expected? calculated? input The value, produced by a glass box (model), can be assessed via its output variables: these should have sufficiently narrow ncertainty intervals. output … and if there is no dependency, there is no graph. input
A Core Course on Modeling Week 6-Models and Confidence Structural Validity Assessment 35 Qualitative validation (structural confidence) 1: examine dependencies in the functional network 2: examine of long range behavior is right Asymptotic behavior is often simpler to predict: a glass box model at least should behave right in the extremes
A Core Course on Modeling Week 6-Models and Confidence Structural Validity Assessment 36 Qualitative validation (structural confidence) 1: examine dependencies in the functional network 2: examine of long range behavior is right 3: examine if singular behavior in isolated points is right Singular behavior of a model means: the behavior in exceptional conditions (e.g., something is 0, two values are equal …)
A Core Course on Modeling Week 6-Models and Confidence Structural Validity Assessment 37 Qualitative validation (structural confidence) 1: examine dependencies in the functional network 2: examine of long range behavior is right 3: examine if singular behavior in isolated points is right 4: examine if things that should converge, have converged validation validation validation verification Many mathematical results cannot be calculated in closed form, but require contribution of many terms. This can only be approximated, but we must certify that at we include at least enough terms.
A Core Course on Modeling Week 6-Models and Confidence Quantitative Validity Assessment 38 Quantitative validation Qualitative validation (structural confidence)
A Core Course on Modeling Week 6-Models and Confidence Quantitative Validity Assessment 39 Quantitative validation: a glass box as input output function may amplify or dampen uncertainties in its input. output uncertainty output uncertainty Sensitivity: the opposite is, when the function hardly reacts on any changes in the input Sensitivity: a function can be said to ‘react’ to changes in its input. In case a function is very sensitive, uncertainties in the input will amplify to larger uncertainties in the output input uncertainty input uncertainty
A Core Course on Modeling Week 6-Models and Confidence Quantitative Validity Assessment 40 For y=f(x), spreading in x causes spreading in y. For small x , we have y = (y / x) x (dy/dx) x = f ’(x) x So for relative spreading y/y and x/x (expressed in %), we have (y/y) / (x/x) = f ’(x) x/y := c(x) (condition number). c(x)=1: 5% spread in x causes 5% spread in y. Large c(x): instable! Condition number is the ratio in relative spreading between output and input: the propagation of uncertainty. Quantitative validation: a glass box as input output function may amplify or dampen uncertainties in its input. output uncertainty output uncertainty input uncertainty input uncertainty
A Core Course on Modeling Week 6-Models and Confidence Quantitative Validity Assessment 41 Quantitative validation: a glass box as input output function may amplify or dampen uncertainties in its input. For y=f(x), we have (y/y)=c(x) (x/x) What about y=f(x1,x2,x3,…)? First try: (y/y)=i |c(xi) | (xi/xi). This is too pessimistic: if xi are independent, they will not all be extreme at once. A better formula is: (y/y)2= i c2(xi) (xi/xi)2. Most glass box models are functions with several arguments. The uncertainties mix, by adding their spreadings squared.
A Core Course on Modeling Week 6-Models and Confidence Quantitative Validity Assessment 42 Quantitative validation: a glass box as input output function may amplify or dampen uncertainties in its input. (y/y)2= i c2(xi) (xi/xi)2 . Properties: • All xi occur squared. Therefore, spreading propertional to n rather than n for n arguments. • All ci occur squared. So even if f/xi<0: no compensation with ‘negative contributions’. • One rotten apple … • To seek room for improvement, search for xi with large i and large ci. Room for improvement: sensitivity analysis helps to assess if adding a functional expression will improve the glass box model.
A Core Course on Modeling Week 6-Models and Confidence Summary 43 • Modeling involves uncertaintybecause of different causes: • Differences between accuracy and precision; • Uncertainty distributionsof values rather than a single value (normal, uniform); • The notions of distanceand similarity; • Confidence for black box models: • Common features of aggregation: average, standard deviationand correlation; • Validationof a black box model: • Residual error: how much of the behavior of the data is captured in the model? • Distinctiveness: how well can the model distinguish between different modeled systems? • Common sense: how plausible are conclusions, drawn from a black box model? • Confidence for glass box models: • Structural validity: do we believe the behavior of the mechanism inside the glass box? • Quantitative validity: what is the numerical uncertainty of the model outcome? • Sensitivity analysisand the propagation of uncertainty in input data; • Sensitivity analysis to decide if a model should be improved.