Activator - Supply
Imagine launching your own landscaping service in the neighborhood. You negotiate prices with your neighbors—$30 for four weekly mowings, $20 for two, and $10 for one monthly service. This scenario illustrates the basic principles of supply and demand in pricing. As your services grow, so do the factors affecting supply like costs and efficiency. Your recent upgrades, including a riding lawnmower, double your capacity. However, rising gas prices pose challenges, showing how external factors shift supply. Learn how pricing impacts service supply and market dynamics.

Activator - Supply
E N D
Presentation Transcript
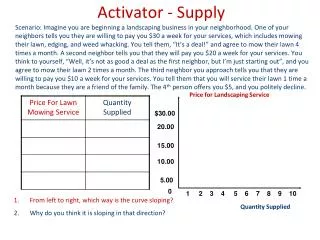
Price for Landscaping Service Quantity Supplied Activator - Supply Scenario: Imagine you are beginning a landscaping business in your neighborhood. One of your neighbors tells you they are willing to pay you $30 a week for your services, which includes mowing their lawn, edging, and weed whacking. You tell them, “It’s a deal!” and agree to mow their lawn 4 times a month. A second neighbor tells you that they will pay you $20 a week for your services. You think to yourself, “Well, it’s not as good a deal as the first neighbor, but I’m just starting out”, and you agree to mow their lawn 2 times a month. The third neighbor you approach tells you that they are willing to pay you $10 a week for your services. You tell them that you will service their lawn 1 time a month because they are a friend of the family. The 4th person offers you $5, and you politely decline. $30.00 20.00 15.00 10.00 5.00 0 1 2 3 4 5 6 7 8 9 10 • From left to right, which way is the curve sloping? • Why do you think it is sloping in that direction?
Activator - Supply Price for Landscaping Service Quantity Supplied Activator - Supply Scenario: Imagine you are beginning a landscaping business in your neighborhood. One of your neighbors tells you they are willing to pay you $30 a week for your services, which includes mowing their lawn, edging, and weed whacking. You tell them, “It’s a deal!” and agree to mow their lawn 4 times a month. A second neighbor tells you that they will pay you $20 a week for your services. You think to yourself, “Well, it’s not as good a deal as the first neighbor, but I’m just starting out”, and you agree to mow their lawn 2 times a month. The third neighbor you approach tells you that they are willing to pay you $10 a week for your services. You tell them that you will service their lawn 1 time a month because they are a friend of the family. The 4th person offers you $5, and you politely decline. $30.00 20.00 15.00 10.00 5.00 0 1 2 3 4 5 6 7 8 9 10 • Which way is the curve sloping? • Why do you think it is sloping in that direction? Upward Price goes up, you are willing to supply more
Supply • Supply – the amount of good and services that sellers are willing and able to sell in the marketplace • The amount of a product thatis offered for sale by a firm(s) at all possible prices
The Law of Supply • Law of Supply – the higher the price offered, the larger the quantity (amount) produced by the supplier; the lower prices offered, the lower quantity supplied • Direct (positive) relationship between price and the QS of a product. PriceAs Prices Increase SupplyQuantity Supplied Increases Price AsPrices Fall Supply Quantity Supplied Falls
Price per home $300 250 200 150 130 100 0 1 3 5 7 9 12 Quantity Supplied of Slices of Pizza • Supply Schedule - a table showing how much of a product a firm(s) will supply at different prices • Supply Curve – a graphic illustration of the supply schedule, which shows how much of a product a firm will supply at different prices. The Supply Schedule and Curve
Changes in the Ability to Supply Scenario: You have been producing for a number of months at the same rate in your landscaping business. In fact, many of your neighbors have requested your services. However, you have previously been unable to fulfill their demand for your services because you are still a full time student and you have to share your time running your business with your time at school. However, the past three months of revenue have allowed you to upgrade your lawnmower from a push to a riding lawnmower. You also recently purchased a gas powered weed whacker and edger. This allows you to more than double your production rate as a result of increased efficiency. Increased Supply
Increase in Supply Price $30.00 20.00 10.00 0 1 2 3 4 5 6 7 8 9 10 Quantity Supplied S1 S2
Changes in the Ability to Supply • Unfortunately, a month into your new production rates gas prices rise. This causes you to have to cut back on production and reduces your ability to supply your service.
Changes in Supply Price $30.00 20.00 10.00 0 1 2 3 4 5 6 7 8 9 10 Quantity Supplied • Unfortunately, a month into your new production rates gas prices triple. This causes you to have to cut back on production and decrease your supply. Plot the new supply schedules on your supply curve. S3 S1 S2
Shifts of the Supply Curve Price • Changes in supply are reflected on the Supply Graph as a shift in the curve • Shifts to the right indicate an increase in the ability to supply (good for the firm) • Easier to produce • Shifts to the left indicate a decrease in the ability to supply (bad for the firm) • Harder to produce Increase in supply Decrease in supply S 2 S 3 S 1 0 Quantity Supplied
What Shifts The Supply Curve?Determinants of Supply • Input Costs • Technology • Government Subsidies • Taxes • Government Regulation • Business Expectations • Supply Shocks
Input Costs Land Labor Capital
Input Costs P S1 S $7.25 x 40 hours = $290 $290 x 4 weeks = $1160 $1160 x 5 workers = $5800 $5800 x 12 months = $69,600 $9.00 x 40 hours = $360 $360 x 4 weeks = $1440 $1160 x 5 workers = $7200 $5800 x 12 months = $86,400
Why Have Corn Prices Increased? Drought and Ethanol
Why Have Beef Prices Risen? P S1 S 0 QD
Input Costs • Input Costs – the cost of producing the good increases/decreased based on the materials necessary to produce (inputs) • Inputs necessary to produce are land, labor, capital
Technology and Innovations • Technological innovations improve the ability to produce and increase ability to supply
Subsidies • Subsidy – a government payment that supports a business or market • Subsidies motivate firms to produce because they are guaranteed revenue from the government
Taxes • Taxes – imposed payments to the government on the production or sale of a good or service • Excise tax (sin tax) on sale of a good or service that is harmful to the consumer • Increased taxes reduce the incentive to produce
Regulation • Regulation – government oversight/influence in a market • Imposed regulations increase the cost of production and will reduce the incentive to produce
Future Expectations of Prices • Expectations – suppliers inventory will reflect how they view the economy in the future • Suppliers will build up their inventory if they feel the economy will be strong, reduce inventory if they feel it will be weak
Number of Sellers • Number of sellers – an increase/decrease in the number of sellers can cause an increase or decrease in the supply of goods and services
Supply Shock • Supply Shock – a sudden shortage of a good due to a natural disaster or human error • Natural disasters – drought, earthquake, hurricane • Human error – gulf oil spill, refinery fire, etc.
Difference Between A Change in Quantity Supplied and a Change in Supply • QS - A change in the amount a supplier will produce as a result of a change in price • Reflected as movement along the curve • S – A change in the amount a supplier can produce as a result of a change in Ceteris Peribus (i.e. investment in new machinery in lawn business) • Reflected as a shift in the curve
Determinants of SupplyWhat Causes a Shift? pg. 116-120 A fall in the cost of inputs (raw materials) will allow more supply to be produced A rise in the cost of inputs (machines, labor, etc.) will reduce supply Robots have replaced human workers on assembly lines, email improves communication. Breakdowns in technology can reduce supply. Payments to farmers create incentive to continue to produce Reduced incentives when government removes subsidies Excise taxes increases costs and reduces supply Removal of taxes decreases costs and increases supply Government intervention increases costs and reduces supply Government deregulation decreases costs and increases supply
Price 25.00 20.00 15.00 10.00 5.00 0 1 2 3 4 5 6 7 8 9 10 11 12 13 14 15 Quantity Plot the schedule below Activator – Combining Supply and Demand Formula – QS - QD 30.00 Surplus Equilibrium Point/Market Clearing Price(Pe/Qe) Shortage S D
Prices • Price – the value of a product as established by supply and demand • A link between producers and consumers
Defining Equilibrium • Equilibrium – the point of balance where demand and supply come together • Market clearing price – price that has cleared the market, accepted by both buyers and sellers • QD = QS
Disequilibrium • Disequilibrium – occurs when the quantity supplied is not equal to the quantity demanded • QD < QS • QD > QS
Excess Demand • Excess Demand – quantity demandedis greater than quantity supplied at the current price • Causes a shortage • Shortage – not enough of a product to satisfy the amount demanded by the consumer • QD > QS • Shortages puts upward pressure on price, forcesprices up
Price 40.00 30.00 20.00 10.00 5.00 0 1 3 5 7 9 11 13 15 17 19 21 23 25 Quantity Application – The Effects of a Change in Demand Plot the schedule below, which represents market supply and demand and the effects of a change in demand. 50.00 New Equilibrium Price/Quantity S D1 D2
Excess Supply • Excess Supply – quantity supplied is greater than quantity demanded at the current price • Creates a surplus • Surplus – to much of a product above what is used or needed • QD < QS • Surpluses put downward pressure on price, forcing prices down
Price 40.00 30.00 20.00 10.00 5.00 0 1 3 5 7 9 11 13 15 17 19 21 23 25 Quantity Application – The Effects of a Change in Supply Plot the schedule below, which represents market supply and demand and the effects of a change in supply. 50.00 New Equilibrium Price/Quantity S1 S2 D
Law of Supply and Demand • Law of supply and demand – the price of any good adjusts to bring the quantity supplied and the quantity demanded for that good into balance reaching a market clearing price • Shortages/Surpluses are short-lived market conditions
Higher demand leads to higher equilibrium price and higher equilibrium quantity. Higher supply leads to lower equilibrium price and higher equilibrium quantity. Increases in Demand and Supply
Lower demand leads to lower price and lower quantity exchanged. Lower supply leads to higher price and lower quantity exchanged. Decreases in Demand and Supply