Download
1 / 63
650 likes | 944 Vues
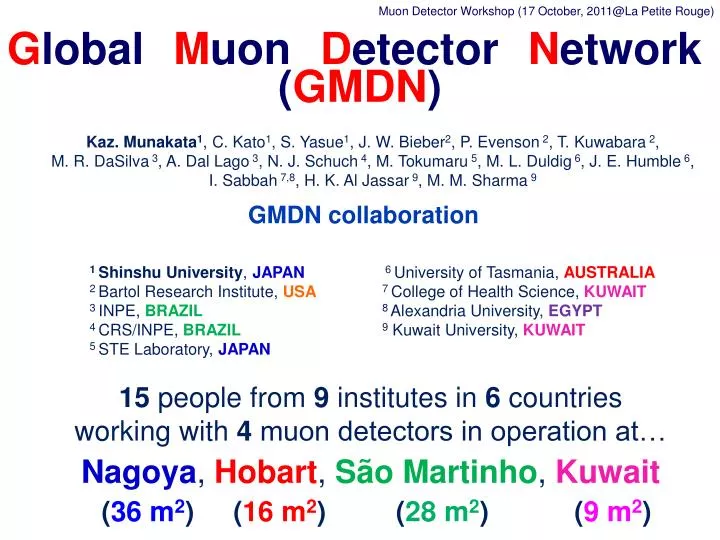
Muon Detector Workshop (17 October, 2011@La Petite Rouge). G lobal M uon D etector N etwork ( GMDN ). Kaz. Munakata 1 , C. Kato 1 , S. Yasue 1 , J. W. Bieber 2 , P. Evenson 2 , T. Kuwabara 2 ,

E N D
Muon Detector Workshop (17 October, 2011@La Petite Rouge) GlobalMuonDetectorNetwork (GMDN) Kaz. Munakata1, C. Kato1, S. Yasue1, J. W. Bieber2, P. Evenson 2, T. Kuwabara 2, M. R. DaSilva 3, A. DalLago 3, N. J. Schuch 4, M. Tokumaru 5, M. L. Duldig 6, J. E. Humble 6, I. Sabbah 7,8, H. K. Al Jassar 9, M. M. Sharma 9 GMDN collaboration 1 Shinshu University, JAPAN 2 Bartol Research Institute, USA 3 INPE, BRAZIL 4 CRS/INPE, BRAZIL 5 STE Laboratory, JAPAN 6 University of Tasmania, AUSTRALIA 7 College of Health Science, KUWAIT 8 Alexandria University, EGYPT 9 Kuwait University, KUWAIT 15 people from 9 institutes in 6 countries workingwith 4 muon detectors in operation at… Nagoya,Hobart,São Martinho,Kuwait (36 m2)(16m2)(28 m2)(9 m2)
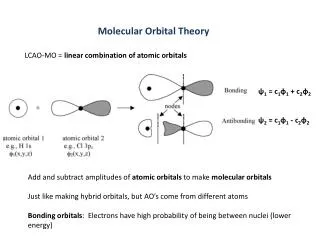
Ground-based detectorsuse atmosphere as an active component • Ground-based detectors measure byproducts of the interaction of primary Galactic Cosmic Rays (GCRs: predominantly protons and helium nuclei) with Earth’s atmosphere. • Two types of observation: • Neutron Monitors Typical energy of primary: ~1 GeVfor solar CRs (GLEs), ~10 GeVfor GCRs ommidirectional • Muon Detectors Typical energy of primary: ~50 GeVfor GCRs (surface muon detector) multi-directional
Energy responses of NM and GMDN to primary GCRs Differential response fn. (solar min.) Integral response fn. (solar min.) 14.5 59.4 Rigidity of primary GCRs (GV)
Viewing directions in the Global Muon Detector Network (GMDN) • ☆indicates the location of the detector. • ○□△display the asymptotic viewing directions of median energy cosmic rays corrected for the geomagnetic bending. • Thin lines indicate the spread of viewing direction for the central 80 % of the energy response to primary CRs.
Deriving anisotropy vector : pressure corrected count rate in the j thdirectional channel of the ithdetector We derive which minimize ….
2D map analysis Nagoya,Hobart,São Martinho Kuwait Four horizontal layers of Proportional Counter tubes 1 hour data(2006 12/14 09:30UT) • Useful when analyzing local-structure like the “loss-cone”. • Applied to the GMDN data(Fushishita et al., ApJ, 715, 2010). N Pitch angle from the sunward nominal IMF S W E
GCR transport equation (Parker 1965) : GCR density (omnidirectional intensity) SW convection diffusion Adiabatic cooling : streaming : anisotropy • Anisotropy () tells us the spatial gradient ( ) • which reflects the magnetic field geometry
What the anisotropy tells us? • GCR density decrease(ForbushDecrease). • Strong GCR streaming (wind) is associated. • Need to measure density & streaming separately. • Only global network can make such a precise measurement . (%) Muon count rates in 3 vertical telescopes 2001 Can deduce 3D distribution from the GCR gradient (G) from the anisotropy G Detector orbit GCR depleted region Single telescope tells us only 1D distribution along the orbit
What does GMDN tell us? http://neutronm.bartol.udel.edu/
Testing the drift model A > 0 A < 0 Away Toward Drift model prediction by Kota and Jokipii (1983) Toward Away 7.5 excursion of the Earth may cause the seasonal variation in the gradient.
FD & CME on Oct. 29, 2003 ICME doy CR density CR anisotropy
GCRs in the Magnetic Flux Rope • GCR depleted region is formed in an expanding MFR into which GCRs can penetrate only through the cross-filed diffusion. • GCR density gradient G pointing away from the MFR can be deduced from the diamagnetic drift streaming. • We deduce MFR geometry from the GCR density gradient by assuming an infinite straight cylinder. GCR depleted region (Forbush decrease) G G(t)
CRs 2R(t) Cross-field diffusion Adiabatic cooling CR diffusion into MFR CRs can penetrate into MFR only by the cross-field diffusion k can be evaluated from CR data during MFR Self-similar expansion of MFR Dimensionless parameter k0 determines k
Numerical solutions • k0 appropriate to the observed • FD is 10 ~ 50. • f (x) rapidly becomes stationary, much earlier than the 1st contact of Earth with MFR at t=1.
Stationary solution f(x) is given by a polynomial expression…. Use polynomial f(x)(n≦6) for best-fitting to the data
Best-fitting to the data(with MFR geometry) Best-fitting at k0=18 k = k0v0R0 = 1.61021 (cm2/s) (v0=0.21 AU/day, R0=0.17 AU) k// ~ 3.01023 (cm2/s) for muon (Munakata et al., 2002) k/ k ~ 0.005 for muon
Z Y X Z Y X cosmic ray ACE B&V IPS STEL SMEI (Tokumaru et al., 2006) (Kuwabara et al., 2007)
Cosmic ray precursors Loss cone (deficit) Magnetic flux rope CR cylinder Shock reflection (excess) Munakata et al. (JGR, 105, 2000) Leerungnavarat et al. (ApJ, 593, 2003) • CRs behind the shock travel to the upstream Earth with the speed of light overtaking the shock ahead. • The precursor is seen as the deficit intensity of CRs arriving from the sunward IMF. • loss-cone (LC) precursor • CRs reflected and accelerated by the approaching shock are also observed as an excess intensity. • precursory excess (sunward) distance from the shock (mfp) pitch angle cosine (anti-sunward) Sunward IMF direction
X3.4 flare onset 02:38UT on 12/13 CME event in December 2006 VSW ~3% FD @~30 GeV Flare onset SSC B CME ejecta Kp No additional disturbances GMDN: CR density average VSW = 1160 km/s 12/13 12/14 12/15 12/16 12/17 GSE-x GSE-y GSE-z Liu et al., ApJ 689, 2008
Sunward IMF directions & FOV Sunward IMF directions by… ×:ACE IMF ●:nominal Parker Field ~20UT, 13 Dec. ~10UT, 13 Dec. ~11UT, 14 Dec. ~04UT, 14 Dec.
Observed 2D maps Hobart São Martinho flare onset flare onset SSC SSC Kuwait
Model for the best-fit analysis (sunward) (anti-sunward) Sunward IMF ( : pitch angle measured from the sunward IMF direction) Shock reflection (excess) Loss-cone (deficit) Loss-cone width (constant) Related to shock normal
Best-fit parameters 2/dof 2 of FD size (-3 %) CLC(t) 2 of typical ( from R-H relation) (Shock reflection) VSW=1030 km/s, =2.7 Bn=56 CEX(t)
Summary • Muon detectors measure muons produced by the interaction of high-energy (E > 1 GeV) primary cosmic rays (CRs) with the atmospheric nuclei. • Due to the high longitudinal momentum transfer to muons, their incident directions well preserve the incident direction of primary CRs ⇒ the multidirectional muon detector. • GMDN is a network of four muon detectors in Japan, Brazil, Australia, Kuwait, and capable for measuring CR intensities from many directions simultaneously. • We measure the CR streamingand CR precursors accurately with the GMDNand deduce the large-scale magnetic structure in the Space Weather. • GMDN has its root on the international collaboration. • Anybody willing to join us would be welcome! • Contact: kmuna00@shinshu-u.ac.jp
possible Canadian muon detectors Parameters set for calculations Obtained detector response (5m×5m PRC detector) Notes: Using Nagashima’s muon response function + IGRF-11 geomagnetic field model (2010). Cut-off and median rigidities are the values at vertical direction
Possible future expansions of GMDN • We plan to expand detection areas of two small detectors. • Hobart: 9 m2⇒ 16 m2, Kuwait : 9 m2⇒ 25 m2 • We also plan to install new detectors in Mexico and South Africa. • Sierra Negra (Mexico) • 4600 m a.s.l.. • 14k SciBars viewed by 220 multi-anode PMTs. • Primarily for the solar neutron detection, but can be used for muon measurement. • Hermanus (South Africa) • 200 PRC tubes in four horizontal layers will form a 25 m2 muon detector.
SciCR (SciBar for the Cosmic Ray observations ) Extrudedscintillator bars (15t) Cosmic rays 3m 1.7m 3m Accelerator beam To be installed on the top of Mt. Sierra Negra(97W, 19N: 4580m a.s.l.) in Mexicoin 2012 Multi-anode PMT (64 ch.) Wave-length shifting fiber
Observation site Mt. Sierra Negra in Mexico Observation hut mini-SciCRprototype detector in operation at Mt. Sierra Negra since Oct. 2010 We put a 5 cm lead layer to absorb the soft-component radiation in the air. X Y We use only two pairs of x-y layers for muon measurement.
Preliminary results with mini-SciCR We trigger the muon measurement by 4-fold coincidence between the top & bottom x-y layers. Observed 2D-maps of hourly count rate Y V X log10(Iobs.) (Iobs.- Ical.)/Ical. (Iobs.- Ical.)/Iobs. Vertical count rate: 473 cph (363 cphfor SciCR with much higher angular resolution) Geomagnetic cut-off rigidity (vertical incident): 7.9 GV Median primary rigidity: 34 GV
Zenith angle distribution Imuon cos~2 log10(flux) : Iobs. : best-fit to Iobs. : Ical. : best-fit to Ical. log10(cos)
Atmospheric pressure (barometer) effect (results from ~1 month measurement without lead layer) Daily variations of Iobs. & P Correlation between Iobs. & P =-0.38 %/hPa P (hPa) Iobs. (%) Iobs. (cph) P (hPa) universal time (h) is larger than the typical ~-0.1 %/hPa for muons probably due to~30 % contamination of AS particles.
Galactic Cosmic Rays (GCRs) • ~85 % protons • ~10 % helium nuclei • a few % heavier nuclei • ~1 % electrons E-2.7 • Observables • Energy spectrum • Elementary & isotopic compositions • Isotropic intensity • (GCR density) • Anisotropy • (GCR streaming) Anchordoqui, L., et al., IJMP (2003)
Drift model (Jokipii et al., ApJ, 213, 1977) qA>0 (Positive) qA<0 (Negative) Ω Ω TS TS M M NS NS qA qM
We first correct the observed GSE, as …. anisotropy density gradient b(t): unit vector along the IMF anisotropy density gradient We haven’t looked at // yet...
São Martinho muon detectorenlarged in December 2005 Two old (useless?) guys in between excellent young people!
Muon detector in Kuwait-City 0.8 m 5 m 5 m • FPGA(Xlinx XC2S200) • Fast identification of incident direction • Count rate in 529 (2323) directions can be stored in 5 FPGAs • Flexible system can be realized • Low power consumption
New data recording system • FPGA(Xlinx XC2S200) • Fast identification of incident direction • Count rate in 441 (2121) directions can be stored in 3 FPGAs • Flexible system can be realized • Low power consumption
Nagoya ~Oct. 1970 (36 m2) Kuwait City ~Mar. 2006 (9 m2) 1970~ 2006~ 2005~ (2001~) Hobart ~Dec. 1991 (9 m2) São Martinho ~Dec. 2005 (28 m2) 1991~ Global Muon Detector Network (GMDN) visit…http://neutronm.bartol.udel.edu/spaceweather/welcome2.html http://cosray.shinshu-u.ac.jp/crest/…for real time plots & data
大気ミューオンの伝播方程式系 :核子(p, n) N → N, X N→ N :パイオン π→ π, X π→ μdecayによるπの減少 N → π π → π :ミューオン π→ μ decayによるμの増加 μ→ edecayによるμの減少 μエネルギーの電離損失
[/m2/s/sr/GV] Response function: : GCR rigidity spectrum :No. of muons with pproduced by a GCR with p(Yield function) GCR Muon detector (atmospheric depth): 550, 720, 940, 1030 [g/cm2] (zenith angle): 0, 16, 32, 48, 64 [] (muon threshold rigidity) : 26 values in 0.178 ~ 5620 [GV]
1次宇宙線 V N,S,E,W NE,NW,N2,S2etc N3,S3 etc :zenith & azimuth angles :geomag. cut-off rigidity k, l : unit telescope