Download
1 / 43
430 likes | 558 Vues
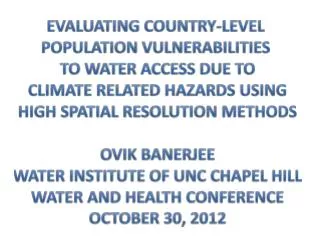
Evaluating country-level Population vulnerabilities to water access due to climate related hazards using high spatial resolution methods Ovik Banerjee Water Institute of UNC Chapel Hill Water And Health Conference October 30 , 2012.

E N D
Evaluating country-level Population vulnerabilities to water access due to climate related hazards using high spatial resolution methods Ovik Banerjee Water Institute of UNC Chapel Hill Water And Health Conference October 30, 2012
Intersection between Water Access and Climate Change • Projected changes in precipitation • Annual direction/volumes vary • Increased variability and intensity • Other changes to hydrological cycle • Altered seasonal flows (snow melt) • Increased evaporation • Increase in water temperature • Sea level rise • Water quality (pathogens and blooms) • Dry conditions • Heat waves more frequent and longer • Drier in mid-latitudes • Wet conditions • Wetter in monsoon regions, tropical Pacific and at high latitudes • Extremes increase more than annual averages
What has Been Done before regarding Climate Change and drinking water Access? • Not exactly nothing, but very little • Many global assessments of climate change and its projected effects, but very few if any assessing the vulnerabilities of countries themselves. Usually assign single numbers for vulnerability for an entire country (low resolution) • Sullivan et al. Water Poverty Index • Most similar project, but has many more metrics, using data sets that are not always available globally, little account of spatial resolution • Joint Monitoring Programme • Measures increases in water availability, but does not take resilience into account • Vision 2030 Report • Most comprehensive evaluation of the resilience of these technologies but does not take into account spatial relationships
Goals of this project To develop a high resolution GIS-based population weighted methodology for assessing the exposure of individual country populations to various climate related hazards To assess current vulnerability of country-level population drinking water access to hazards (flood, drought and cyclone) using available datasets To rank countries based on vulnerability To create a visual display to depict and compare these values easily on a country by country basis.
Components • Climate related hazards: A measure of the likelihood of the individual hazards was required in a geospatial form, i.e., a measure of the drought, cyclone, and flood likelihoods was needed at a spatial level. • Population: Global population information was needed, on a geospatial form as well instead of the traditional country by country break down. Spatially related population data was required to see the relationship between population and their exposure and relative vulnerability to hazardous events. • Technology coverage: Water delivery technology coverage was needed on a country by country level. Population data was important as well for technology coverage, because data had to be differentiated between urban and rural areas, so a demarcation was required. • Technology resilience: A scoring system of resilience of the individual technologies to the individual hazards associated with climate change was also needed. • Adaptive capacity: A measure of central adaptive capacity of the government of individual countries was also desired when calculating vulnerability to account for the ability of the country in question to react to a disaster that could occur.
Likelihood of Events • From the Center for Hazards and Risk Research • Based on historical data • 2.5 by 2.5 arc minute cells • Scale of 0-10. Standardized between values, not actually meaningful numbers. 0 is no risk, 10 is highest risk • Why is likelihood used? • Other options were available: economic loss, mortality • Those factors would be double counted as they are a measure of the metric we are using for adaptive capacity • Also, no better way to decide the likelihood of natural event coming
Likelihood of Events Global Cyclone Hazard Assessment (Adapted from CHRR)
Likelihood of Events Global Drought Hazard Assessment (Adapted from CHRR)
Likelihood of Events Global Drought Hazard Assessment (Adapted from CHRR)
Population • Worldwide 2.5 by 2.5 arc minute break downs of population density. Used to determine urban/rural classification and total country population. • How is this used in final equation? • Initially, population density used to classify grids into rural versus urban
Population Population Density 2000 (CIESN and CIAT)
Population weighted Risk Exposure (High) Sample Country with likelihoods and population scores Likelihood of hazard Total Country Population 3300 0.946 Population of the cell (PopCell) Likelihood of the event of a specific hazard occurring (LEH) Population of the country (PopCountry)
Population weighted Risk Exposure (Low) Sample Country with likelihoods and population scores Likelihood of hazard Total Country Population 3300 0.063 Population of the cell (PopCell) Likelihood of the event of a specific hazard occurring (LEH) Population of the country (PopCountry)
Population Country Population Likelihood of Event Country Population Weighted Risk Exposure CHRR Calculated from data CIESN/CIAT 2.5*2.5 Arc Minute Grid 2.5*2.5 Arc Minute Grid Country by country data Technology Coverage Technology Resilience Country Resilience Score JMP Data Elliott et al. 2010 Country by country data, Rural/Urban Scores same globally, specific to hazards Country Vulnerability Score Adaptive Capacity GAIN Index Country by country data Color Key Inputs Data Source Geospatial Scale Outputs
Technology Coverage • JMP Data- watsan coverage (percentage out of 100%), • Differentiates between urban and rural • Different technologies
Population Country Population Likelihood of Event Country Population Weighted Risk Exposure CHRR Calculated from data CIESN/CIAT 2.5*2.5 Arc Minute Grid 2.5*2.5 Arc Minute Grid Country by country data Technology Coverage Technology Resilience Country Resilience Score JMP Data Elliott et al. 2010 Country by country data, Rural/Urban Scores same globally, specific to hazards Country Vulnerability Score Adaptive Capacity GAIN Index Country by country data Color Key Inputs Data Source Geospatial Scale Outputs
Adaptive capacity • Country level adaptability data (GAIN) http://index.gain.org/ • Readiness comprised of economic, government, and social factors • Different from other component of GAIN Index (vulnerability), which includes water, food, health, and infrastructure components. • Water component consisted of metrics such as: • projected change in precipitation • percent population with access to improved water supply, • projected change in temperature
Population Country Population Likelihood of Event Country Population Weighted Risk Exposure CHRR Calculated from data CIESN/CIAT 2.5*2.5 Arc Minute Grid 2.5*2.5 Arc Minute Grid Country by country data Technology Coverage Technology Resilience Country Resilience Score JMP Data Elliott et al. 2010 Country by country data, Rural/Urban Scores same globally, specific to hazards Country Vulnerability Score Adaptive Capacity GAIN Index Country by country data Color Key Inputs Data Source Geospatial Scale Outputs
Initial Conclusions • Geographic location is a primary driver of vulnerability (exposure to various hazards) • Technology coverage/resilience and adaptive capacity both have the power to effect vulnerability
Limitations • The population numbers that were calculated using the CIESN and CIAT data did not always match up to data attributable to UN STATS. • The map used for country boundaries did not always fully encapsulate populations. • This had an effect on a very small number of countries • Does not include the effects of one of the most prominent effects of climate change, sea level rise. • Difficulty differentiating between drought and aridity.
Assumptions • No available data for consideration of local adaptive capacity, so assumed it was consistent across the country • Country-wide homogenous distribution of technology coverage
Applications The greatest value in this work is in two parts: Presenting the country level population weighted risk exposure, resilience, and vulnerability in a visual and geospatially relevant way 2) The actual scoring and ranking of countries at every level along the way
Future Work Refining the parameters in each of the four major categories (climate, population, technology and adaptive capacity) Transitioning from using current estimates to using future projections Climate More representative data for “current” hazard probability More comprehensive list of hazards (sea level rise) Hazard severity Climate projections Population Urban/rural population fractions future population growth and distribution Higher resolution of the population dataset