Download
1 / 1
10 likes | 123 Vues
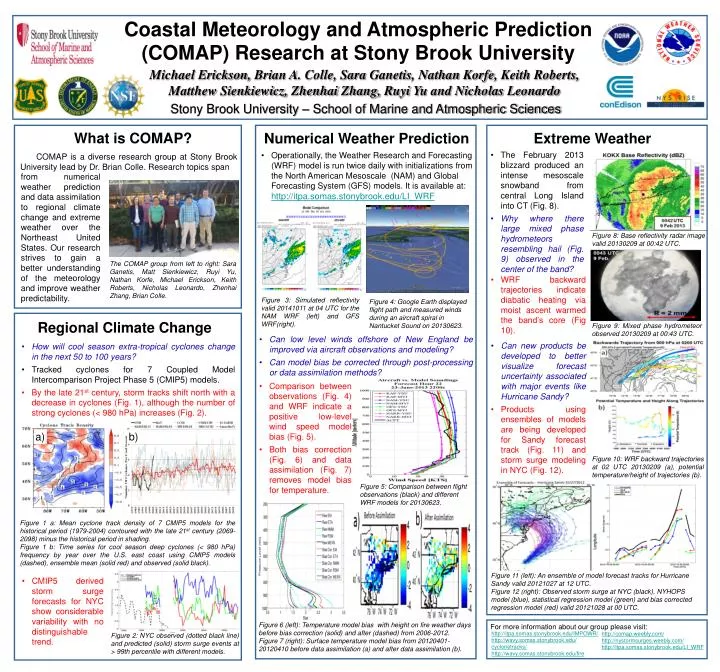
Coastal Meteorology and Atmospheric Prediction (COMAP) Research at Stony Brook University. Michael Erickson, Brian A. Colle, Sara Ganetis , Nathan Korfe , Keith Roberts, Matthew Sienkiewicz, Zhenhai Zhang, Ruyi Yu and Nicholas Leonardo

E N D
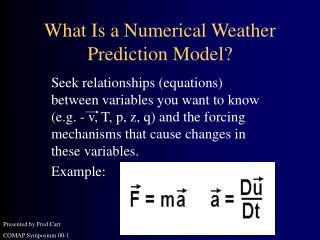
Coastal Meteorology and Atmospheric Prediction (COMAP) Research at Stony Brook University Michael Erickson, Brian A. Colle, Sara Ganetis, Nathan Korfe, Keith Roberts, Matthew Sienkiewicz, Zhenhai Zhang, Ruyi Yu and Nicholas Leonardo Stony Brook University – School of Marine and Atmospheric Sciences Extreme Weather What is COMAP? • The February 2013 blizzard produced an intense mesoscalesnowband from central Long Island into CT (Fig. 8). • Why where there large mixed phase hydrometeors resembling hail (Fig. 9) observed in the center of the band? • Operationally, the Weather Research and Forecasting (WRF) model is run twice daily with initializations from the North American Mesoscale (NAM) and Global Forecasting System (GFS) models. It is available at: http://itpa.somas.stonybrook.edu/LI_WRF COMAP is a diverse research group at Stony Brook University lead by Dr. Brian Colle. Research topics span from numerical weather prediction and data assimilation to regional climate change and extreme weather over the Northeast United States. Our research strives to gain a better understanding of the meteorology and improve weather predictability. Figure 8: Base reflectivity radar image valid 20130209 at 00:42 UTC. The COMAP group from left to right: Sara Ganetis, Matt Sienkiewicz, Ruyi Yu, Nathan Korfe, Michael Erickson, Keith Roberts, Nicholas Leonardo, Zhenhai Zhang, Brian Colle. • WRF backward trajectories indicate diabatic heating via moist ascent warmed the band’s core (Fig 10). • Can new products be developed to better visualize forecast uncertainty associated with major events like Hurricane Sandy? • Products using ensembles of models are being developed for Sandy forecast track (Fig. 11) and storm surge modeling in NYC (Fig. 12). Figure 3: Simulated reflectivity valid 20141011 at 04 UTC for the NAM WRF (left) and GFS WRF(right). Figure 4: Google Earth displayed flight path and measured winds during an aircraft spiral in Nantucket Sound on 20130623. Regional Climate Change Figure 9: Mixed phase hydrometeor observed 20130209 at 00:43 UTC. • Can low level winds offshore of New England be improved via aircraft observations and modeling? • Can model bias be corrected through post-processing or data assimilation methods? • How will cool season extra-tropical cyclones change in the next 50 to 100 years? • Tracked cyclones for 7 Coupled Model Intercomparison Project Phase 5 (CMIP5) models. • By the late 21st century, storm tracks shift north with a decrease in cyclones (Fig. 1), although the number of strong cyclones (< 980 hPa) increases (Fig. 2). Numerical Weather Prediction • Comparison between observations (Fig. 4) and WRF indicate a positive low-level wind speed model bias (Fig. 5). • Both bias correction (Fig. 6) and data assimilation (Fig. 7) removes model bias for temperature. a) b) Figure 10: WRF backward trajectories at 02 UTC 20130209 (a), potential temperature/height of trajectories (b). Figure 5: Comparison between flight observations (black) and different WRF models for 20130623. Figure 1 a: Mean cyclone track density of 7 CMIP5 models for the historical period (1979-2004) contoured with the late 21st century (2069-2098) minus the historical period in shading. Figure 1 b: Time series for cool season deep cyclones (< 980 hPa) frequency by year over the U.S. east coast using CMIP5 models (dashed), ensemble mean (solid red) and observed (solid black). Figure 11 (left): An ensemble of model forecast tracks for Hurricane Sandy valid 20121027 at 12 UTC. Figure 12 (right): Observed storm surge at NYC (black), NYHOPS model (blue), statistical regression model (green) and bias corrected regression model (red) valid 20121028 at 00 UTC. • CMIP5 derived storm surge forecasts for NYC show considerable variability with no distinguishable trend. Figure 6 (left): Temperature model bias with height on fire weather days before bias correction (solid) and after (dashed) from 2006-2012. Figure 7 (right): Surface temperature model bias from 20120401-20120410 before data assimilation (a) and after data assimilation (b). For more information about our group please visit: http://itpa.somas.stonybrook.edu/IMPOWR/ http://wavy.somas.stonybrook.edu/ cyclonetracks/ http://wavy.somas.stonybrook.edu/fire http://comap.weebly.com/ http://nystormsurges.weebly.com/ http://itpa.somas.stonybrook.edu/LI_WRF Figure 2: NYC observed (dotted black line) and predicted (solid) storm surge events at > 99th percentile with different models.