Download
1 / 35
350 likes | 458 Vues
Establishing National Public Reporting in Australia. International best p ractice in public p erformance r eporting: Sydney, Sunday 7 July 2013. Bernie Harrison: Executive Director Hospital Performance. National Health Reform Act 2011.

E N D
Establishing National Public Reporting in Australia International best practice in public performance reporting: Sydney, Sunday 7 July 2013 Bernie Harrison: Executive Director Hospital Performance
National Health Reform Act 2011 • Australian Commission on Safety and Quality in Health Care • National Health Performance Authority • Independent Hospital Pricing Authority • National Health Funding Body
National Health Reform Agreement • ‘The objective of this Agreement is to improve health outcomes for all Australians and the sustainability of the Australian health system’ • Will deliver major structural reform and provide for more sustainable funding arrangements for Australia’s health system.
Our mission • Subtitle The National Health Performance Authority will monitor, and report on, the comparable performance of health care organisations to stimulate and inform improvement in the Australian health system, increase transparency and accountability and inform consumers. Prepared DD/MM/YYY
Our vision The Australian community will have access to and use timely, impartial and user-friendly information about the comparable performance of health care organisations and local health systems.
Monitor, and report on, the performance of the following: • Local hospital networks • Public hospitals • Private hospitals • Primary health care organisations • Other bodies or organisations that provide health care services.
Massive variation in clinical practice High rates of inappropriate care Unacceptable rates of preventable injuries Under use of effective treatments. Healthcare fails its theoretical potential Brent James IHC, European Forum Paris 2008
Six Sigma performance • 99.99966% of the outcomes of processes are expected to be free of defects, i.e. three defects per million • What do we do?
Safety hazards and everyday probabilities (AHRQ) Events per million opportunities
The “Quality Curve” 2 Shift and narrow the curve: What is the norm? 3 1 Extend the ambition: What is great? (What is possible?) Cut the tail: What is unacceptable?
The “Quality Journey” Culture Comparison Compliance • To meet all required targets • To be better than others, locally or nationally • To be the best we can possibly be How we define ‘good’ Source of motivation to deliver • From outside • Imposed • From outside • Top-down • From inside • Internal, personal Duration • Episodic • Episodic • Ongoing Source: IHI Executive Patient Safety Program 2010
Trust, in professionals and public sector staff to use principled motivation to bring about improvements in public services Command and control, to use targets and top-down performance management to bring about change Voice, to empower public service users to complain and in so doing to exert pressure for reform Choice and competition, to create incentives for service providers to be responsive to the needs of users and efficient use of resources. Four ways to deliver public services
What works? Dr Foster Intelligence. Hospital Guide. 2011
Speaking at the publication of his final report, Robert Francis QC said: "I heard so many stories of shocking care. These patients were not simply numbers they were husbands, wives, sons, daughters, fathers, mothers, grandparents. They were people who entered Stafford Hospital and rightly expected to be well cared for and treated. Instead, many suffered horrific experiences that will haunt them and their loved ones for the rest of their lives." Independent inquiry into care provided by Mid Staffordshire NHS Foundation Trust January 2005 – March 2009. Chaired by Robert Francis QC
Hospital Standardised Morality Ratio in the NHS: • 2002: 115 • 2006: 100 • 2011: 67
COAG indicators for hospitals (examples) • Effectiveness – Safety and quality • Hospital mortality • Unplanned re-admissions • Effectiveness – Patient experience • Measure of patient experience • Equity and effectiveness – Access • Access to services by type of service compared to need • Cancer care pathway – waiting times for cancer care • Elective surgery waiting times by urgency category • Efficiency and financial performance • Relative stay index for multi-day stay patients • Day or surgery admission rates for non-emergency multi-day patients • Cost per case mix weighted separation. Subtitle Prepared DD/MM/YYY
COAG indicators for Medicare Locals (examples) • Effectiveness – Safety and quality • Selected potentially avoidable hospitalisations • Effectiveness – Patient experience • Measure of patient experience • Equity and effectiveness – Access • Access to services by type of service compared to need • GP type service use • Vaccination rates for children • Number of women with at least one antenatal visit in the first trimester • Health outcome context • Prevalence of diabetes • Infant/young child mortality rate. Subtitle Prepared DD/MM/YYY
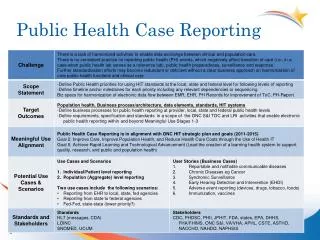
Hospital Performance: Time patients spent in emergency departments in 2011-12 Figure 1: Percentage of all patients departing ED within four hours of arrival amongst the largest hospital EDs in Australia, by peer group1, 2011–12
COAG indicators • The report examines use, patient experiences and the perceived health of populations living in each Medicare Local area against a range of indicators, including: • GP attendances • Measures of patient experiences • Wait times for GP services • After-hours GP service utilisation. Subtitle Prepared DD/MM/YYY
www.nhpa.gov.au www.myhospitals.gov.au Our websites www.myhealthycommunities.gov.au
Hitting the headlines Healthy Communities: Immunisation rates for children in 2011-12 SMH, 13 April 2013 Five days after launch 567 total news stories 16.8 million total audience 28 days after launch 718 total news stories 23 million total audience SMH, 11 April 2013 Courier Mail, 11 April 2013
Impact Campaign launched by Australia’s biggest-selling newspaper Sunday Telegraph, 5 May 2013
Impact Sunday & Daily Telegraph (NSW) launches the ‘No Jab No Play’ campaign Banner published on home page on 5 May 2013 The Sunday Telegraph is Australia’s biggest selling paper with an audited circulation of 600,000 The Daily Telegraph is Australia’s second biggest selling daily paper with an audited circulation of 330,000
NSW’s Telegraph initiates the ‘No Jab No Play’ campaign, 5 May 2013 Readers urged to sign the Telegraph’s vaccination petition The Daily Telegraph is Australia’s second biggest selling daily paper with an audited circulation of 330,000 The Sunday Telegraph is Australia’s biggest selling paperwith an audited circulation of 600,000 Media
Impact NSW cabinet agrees to amend Public Health Act 29 May 2013 – NSW cabinet agrees to change the Public Health Actmeaning parents in NSW have to show proof that their child is fully vaccinated or apply for an exemption before being accepted into child care
Media coverage compared Healthy Communities: Immunisation rates for children in 2011–2012 Report released 11 April 2013 567 items published in 5 days following release reaching a total audience of 16.8 million 727 items published in the 30 days following release reaching a total audience of over 23 million Healthy Communities: Australians’ experiences with primary health care in 2010–2011 Report released 7 March 2013 120 items published in 5 days following release reaching a total audience of 2.4 million 151 items published in the 30 days following release reaching a total audience of 3.3 million Hospital Performance: Time patients spent in emergency departments in 2011–12 Report released 14 December 2012 172 items published in 5 days following release reaching a total audience of 7.3 million Source: Mediaportal data analysis, National Health Performance Authority
Third Dutch Health care performance report 2010 Quality: Safety, Effectiveness, Co-ordination, Responsiveness The government has a duty to safeguard the public interest of good-quality health care and the tools to do so. … The legislator puts health care providers/professionals under a number of obligations. They must provide appropriate care, i.e. organise their work, provide personnel and equipment, and allocate responsibilities, such that it does or should lead to appropriate care. They should systematically monitor, control and improve quality of care. And, they should account for their actions in this respect.
Thank you www.nhpa.gov.au