Download
1 / 34
350 likes | 513 Vues
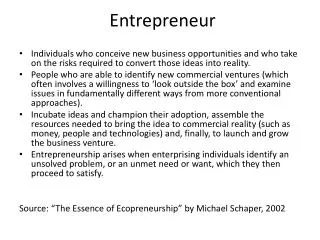
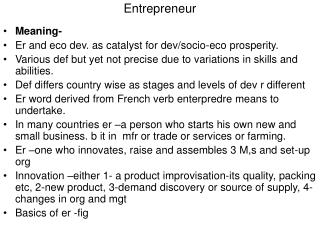
ENTREPRENEUR Commercialization. GO. DEFINING the Topic. The licensed technology is the primary product or service of…. Who are fully dedicated to the development of the company and the technology. An early stage company managed by founders….

E N D
DEFINING the Topic • The licensed technology is the primary product or service of… Who are fully dedicated to the development of the company and the technology. An early stage company managed by founders… For this topic we define “entrepreneur commercialization” as situations where-
Number of PARTICIPANTS 500,000new “employer businesses”are formed each year An employer business is one that intends to add additional workers • This number represents- • Less than 1% of households • About 3% of workers
Another PERSPECTIVE Data from the Kauffman Foundation indicate a lower company formation rate Non IT startups number less than 20,000 High technology businesses represent less than 10% of all new firms
Tech Transfer Activity What about funded research based startups?
Tech Transfer Activity Proxy- UNIVERSITY STARTUPS Data from the Association of University Technology Managers’ annual surveys The rate of equity participation by universities follows a different pattern Startup formation has grown 3.5X since the surveys began
Licenses FundedResearch InventionDisclosures Patents Inventor Tech Transfer Office Tech Transfer Activity Commercialization PATH Common wisdom says that the technology transfer screening process creates the following activity levels-
Tech Transfer Activity OpportunityFLOW The number of invention disclosures has more than doubled Patent applications have quadrupled in the same time period
Tech Transfer Activity NORMALIZED Flow Research institutions recognizing the value of their technologies, or… Is there patenting of marginal technologies due to pressure to achieve results?
Tech Transfer Activity Invention VALIDATION The patent success rate (2 year lag) is declining This suggests a quality decline Challenges at the US Patent & Trademark Office during this period may have contributed to the decline
Tech Transfer Activity STARTUP Activity Startup formation appears to be following applications, not awarded patents A reflection of pent up demand, or… Chasing an elusive pot of gold?
Tech Transfer Activity Path REVISITED • Analysis of data by institution suggest wide variance in this average performance- • $25MM to $250MM of research per startup
Startup Activity What happens at the institution level?
Startup Activity Startup LEVELS Of the 180+ US universities who reported to AUTM in the last two available years Numbers of startups per institution varied widely
Startup Activity ALTERNATE View Non/low participation rates haven’t changed much… The upper tier (six startups and above) has risen by 50%
Funding Activity How many startups are being funded?
Funding Activity ANGEL CAPITAL Activity 70,730companies received “angel capital”in 2013 University of New Hampshire Center for Venture Research This represents about one in eight new companies • Most angel capital is informal- • Personal networks • Small amounts
Funding Activity VENTURE CAPITAL Activity 1,334firms received a first venture capital round in 2013 Less than 0.20% of startups enter the venture capital world each year This number hasn’t changed much over the last five years
Funding Activity Venture Capital AVAILABILITY Overlay of AUTM data on PWC MoneyTreeseed stage funding data Research-related startup activity exceeds available venture capital funding
Funding Activity GeographicBIAS Availability of venture capital is further constrained by geography VCs work close to home
Startup Outcomes What happens after a company gets founded?
Startup Outcomes OVERALL Survival Rates Just over half of new firms survive three years
Startup Outcomes ANGEL FUNDED Outcomes • Data from a study of- • 539 investors • 3097 companies • 1137 outcomes • Angel funding does create big winners • 14% of companies Overall survival rates are only slightly better
Startup Outcomes VENTURE CAPITAL Outcomes • NVCA analysis of ten years of investments • Outcomes sometimes difficult to determine • Similar to angel capital experience- • Over half fail or lose money • 1 in 7 big wins
Support & Analysis SURVEY- University Ecosystems • Data from- • 30 institutions • Avg. $80 MM research budget Comprehensive view of ecosystem structure Geographically and structurally diverse Survey of startup ecosystems at universities
Support & Analysis INSTITUTIONAL Support Large research universities engage with startups across multiple departments Beware of conflicts between departmental goals and startup effectiveness
Support & Analysis FUNDING Assistance Recognizing the funding gap, universities are providing broad-based support for capital raising New emphasis on proof-of-concept funds
Support & Analysis MANAGEMENT Assistance Outside of the established startup ecosystems universities provide a broad range of support mechanisms for entrepreneurs Understanding how to marshal these resources is a key driver of success
Support & Analysis RESULTS Availability of resources and support mechanisms alone are not indicative of success The process is complex Coordination of these resources is critical
Foundation &Infrastructure(Funding) InventionReadiness(Patenting) Market &ProductAssessment Business Plan& Management Process Opportunity COSTS • Costs to commercialize a technology in a startup can be significant • Total out-of-pocket costs can be more than $100,000 • Patenting: $5K to $50K • Commercial Assessment: $0 to $25K • Licensing Legal: $5K to $10K • Business Plan & Team: $0 to $50K • Capital Raising Legal & Travel: $5K to $40K
Process REVIEWING Opportunities Tech transfer offices are undertaking more comprehensive reviews prior to licensing to startups
Questions and Discussions http://www.rpxgroup.com 312.291.9000 - BobOkabe 225 West Washington Street Suite 1500 Chicago, IL 60606