Treatment
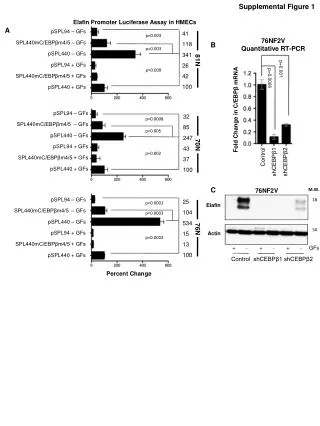
Supplemental Figure 1. Elafin Promoter Luciferase Assay in HMECs. A. pSPL94 – GFs SPL440mC/EBPβm4/5 – GFs pSPL440 – GFs pSPL94 + GFs SPL440mC/EBPβm4/5 + GFs pSPL440 + GFs. 41 118 341 26 42 100. p=0.003. Treatment. 76NF2V Quantitative RT-PCR. B. p=0.003. 81N. p=0.009. p=0.001.

Treatment
E N D
Presentation Transcript
Supplemental Figure 1 Elafin Promoter Luciferase Assay in HMECs A pSPL94 – GFs SPL440mC/EBPβm4/5 – GFs pSPL440 – GFs pSPL94 + GFs SPL440mC/EBPβm4/5 + GFs pSPL440 + GFs 41 118 341 26 42 100 p=0.003 Treatment 76NF2V Quantitative RT-PCR B p=0.003 81N p=0.009 p=0.001 Fold Change in C/EBPβ mRNA p=0.0006 pSPL94 – GFs SPL440mC/EBPβm4/5 – GFs pSPL440 – GFs pSPL94 + GFs SPL440mC/EBPβm4/5 + GFs pSPL440 + GFs 32 85 247 43 37 100 p=0.0008 p=0.005 Control shCEBPβ1 shCEBPβ2 70N p=0.002 C 76NF2V M.W. pSPL94 – GFs SPL440mC/EBPβm4/5 – GFs pSPL440 – GFs pSPL94 + GFs SPL440mC/EBPβm4/5 + GFs pSPL440 + GFs 18 25 104 534 15 13 100 p=0.0001 Elafin p=0.0003 76N 50 Actin p=0.0002 + - + - + - GFs Control shCEBPβ1 shCEBPβ2 Percent Change
Supplemental Figure 2 76NE6 76NE7 76NF2V A G0/G1 S G2 Cell Cycle Distribution Time (hours) B M.W. M.W. 76NF2V 76NE6 18 18 Elafin 50 50 Actin 76NF2V 76NE6 Relative Elafin Expression Time (hours) C Cell Cycle Distribution 81N 81NE6 81NE7 Cell Cycle Distribution + - + - + - GFs Treatment M.W. 18 D Elafin Actin 50 + - + - + - GFs 81N 81NE6 81NE7
Supplemental Figure 3 A M.W. Elafin 18 50 Actin 0 6 12 24 48 0 6 12 24 48 0 6 12 24 48 hr Control shElafin 1 shElafin 2 B -GFs 48 hr M.W. 18 Elafin 50 Actin -GFs 96 hr M.W. 18 Elafin Actin Control shElafin1 + wt shElafin2 + wt shElafin1 + R1 shElafin1 + R1 M25G shElafin1 + R1 M25K shElafin2 + R2 shElafin2 + R2 M25G shElafin2 + R2 M25K 50
Supplemental Figure 4 A Add Inhibitors B PBS DMSO GW311616 Sivelestat 76NE6 Percent Change in Cell Number Concentration of NE (μM) -24 0 22 24 48 72 hr Plate HMECs Remove Growth Factors Add NE MTT
Supplemental Figure 5 A B 76NE6 48-hour Quantitative RT-PCR p=0.05 p=0.02 Elafin EGR1 Normalized Fold Change p=0.02 p=0.01 Control shElafin1 shElafin2
Supplemental Figure 6 M.W. A 50 pERK 3.9 1.0 4.6 2.4 Total ERK 50 0 15 30 60 min B qPCR of ERK Target Genes p=0.05 EGR1 FOS Normalized Fold Change p=0.005 p=0.009 0 3 6 Time Post NE Addition (hours) C Control siRNA MEK1 siRNA DMSO U0196 pERK1/2 Total ERK1/2 0 15 30 45 0 15 30 60 0 15 30 45 15 30 45 minutes D E PBS DMSO U0126 76NE6 76NE6 siControl siMEK Percent Change in Cell Number Percent Change in Cell Number Concentration of NE (μM) Concentration of NE (μM)
Supplemental Figure 7 X X 50% 50% X 100% X