Download
1 / 21
210 likes | 355 Vues
Effect of Human Activity on Deer Frequency in the DePauw University Nature Park. Amanda Faulkenberg and Caitlin Cleary. Introduction. Idea Motivation Previous Research. Connection to Conservation. Are humans going to negatively affect deer? humans are a perceived threat.

E N D
Effect of Human Activity on Deer Frequency in the DePauw University Nature Park Amanda Faulkenberg and Caitlin Cleary
Introduction • Idea • Motivation • Previous Research
Connection to Conservation • Are humans going to negatively affect deer? • humans are a perceived threat
Hypotheses and Predictions • Deer trails will be more abundant in the study area further from the human hiking trails compared to those plots found in the area closest to the trails. • More deer photographs will be captured on the camera traps in the plots with the most trails and further from human activity.
Study Location and Species • DePauw Nature Park • Quarry Hillside • Quarry South • 5 plots in each area (randomly selected) • White-tailed deer
Methods: Trail Calculation • Trail Length • Average Trail Width • Total Trail Area
Methods: Plot and Camera Locations • Randomly selected 5 plots in Quarry Hillside and Quarry South off of the grid maps. • Flagged and labeled each corner to the plots (NW, NE, SW, SE) • Chose 4 of 5 plots in Quarry Hillside and Quarry South to place cameras in.
Methods: Photograph Data • 8 cameras total • 4 in Quarry Hillside • 4 in Quarry South • Located in each plot along deer trails (roughly ten meters away) • Cameras used: • Moultrie
Statistical Analysis • Kruskal-Wallis Nonparametric Test
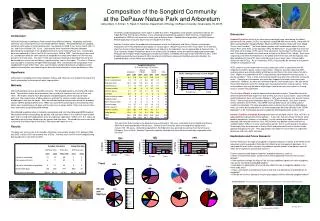
Results: Trails • Significantly more total deer trail area in the Quarry South Plots (Kruskal-Wallis, p=0.008)
Results: Photograph Data • Not Significant (Kruskal-Wallis, p=0.057)
Supplementary Data: Trees • Significantly more trees in the Quarry Hillside plots (Kruskal-Wallis, p=0.008)
Conflicting results • Many trails in Quarry South but small number of deer. • Many deer in Quarry Hillside but small amount of trails.
What Next? • Consistent Cameras? • Implications of the understory • Use of man-made trails • Tree obstructions