Download
1 / 1
10 likes | 128 Vues
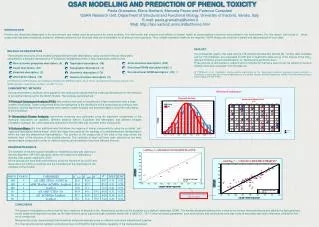
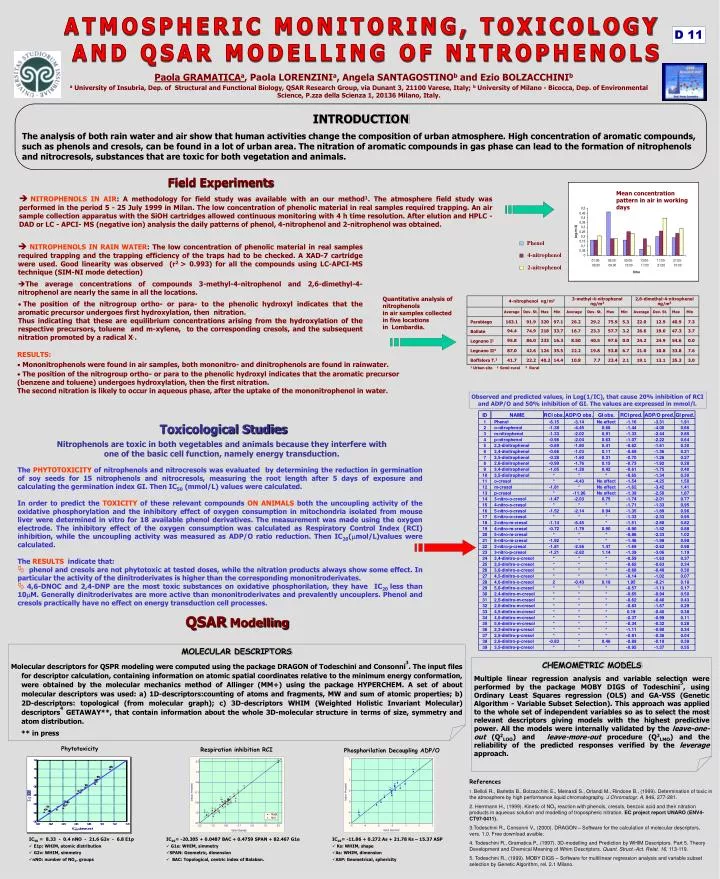
Phenol. 4-nitrophenol. 2-nitrophenol. 3-methyl-4-nitrophenol ng/m 3. 2,6-dimethyl-4-nitrophenol ng/m 3. 4-nitrophenol ng/m 3. Average. Dev. St. Max. Min. Average. Dev. St. Max. Min. Average. Dev. St. Max. Min. Parabiago. 163.1. 91.9. 320. 97.1. 26.2. 29.2. 75.9. 5.3.

E N D
Phenol 4-nitrophenol 2-nitrophenol 3-methyl-4-nitrophenol ng/m3 2,6-dimethyl-4-nitrophenol ng/m3 4-nitrophenol ng/m3 Average Dev. St. Max Min Average Dev. St. Max Min Average Dev. St. Max Min Parabiago 163.1 91.9 320 97.1 26.2 29.2 75.9 5.3 22.0 12.9 40.9 7.3 94.4 74.9 218 33.7 16.7 23.3 57.7 3.2 26.6 19.0 47.3 3.7 Bollate 95.8 86.0 233 16.3 8.50 40.5 97.6 0.0 24.2 24.9 54.6 0.0 Legnano I1 Legnano II2 87.0 42.6 124 35.5 22.2 19.8 53.8 6.7 21.0 10.8 33.8 7.6 Boffalora T.3 41.7 22.2 40.2 14.4 10.8 7.7 23.4 2.1 19.1 13.1 35.3 3.0 1 Urban site 2 Semi-rural 3 Rural ATMOSPHERIC MONITORING, TOXICOLOGY AND QSAR MODELLING OF NITROPHENOLS D 11 Paola GRAMATICAa, Paola LORENZINIa, Angela SANTAGOSTINOb and Ezio BOLZACCHINIb a University of Insubria, Dep. of Structural and Functional Biology, QSAR Research Group, via Dunant 3, 21100 Varese, Italy; b University of Milano - Bicocca, Dep. of Environmental Science, P.zza della Scienza 1, 20136 Milano, Italy. INTRODUCTION The analysis of both rain water and air show that human activities change the composition of urban atmosphere. High concentration of aromatic compounds, such as phenols and cresols, can be found in a lot of urban area. The nitration of aromatic compounds in gas phase can lead to the formation of nitrophenols and nitrocresols, substances that are toxic for both vegetation and animals. Field Experiments Mean concentration pattern in air in working days • NITROPHENOLS IN AIR: A methodology for field study was available with an our method1. The atmosphere field study was performed in the period 5 - 25 July 1999 in Milan. The low concentration of phenolic material in real samples required trapping. An air sample collection apparatus with the SiOH cartridges allowed continuous monitoring with 4 h time resolution. After elution and HPLC - DAD or LC - APCI- MS (negative ion) analysis the daily patterns of phenol, 4-nitrophenol and 2-nitrophenol was obtained. • NITROPHENOLS IN RAIN WATER: The low concentration of phenolic material in real samples required trapping and the trapping efficiency of the traps had to be checked. A XAD-7 cartridge were used. Good linearity was observed (r2 > 0.993) for all the compounds using LC-APCI-MS technique (SIM-NI mode detection) • The average concentrations of compounds 3-methyl-4-nitrophenol and 2,6-dimethyl-4-nitrophenol are nearly the same in all the locations. • The position of the nitrogroup ortho- or para- to the phenolic hydroxyl indicates that the aromatic precursor undergoes first hydroxylation, then nitration. • Thus indicating that these are equilibrium concentrations arising from the hydroxylation of the respective precursors, toluene and m-xylene, to the corresponding cresols, and the subsequent nitration promoted by a radical X.. Quantitative analysis of nitrophenols in air samples collected in five locations in Lombardia. RESULTS: • Mononitrophenols were found in air samples, both mononitro‑ and dinitrophenols are found in rainwater. • The position of the nitrogroup ortho‑ or para to the phenolic hydroxyl indicates that the aromatic precursor (benzene and toluene) undergoes hydroxylation, then the first nitration. • The second nitration is likely to occur in aqueous phase, after the uptake of the mononitrophenol in water. Observed and predicted values, in Log(1/IC), that cause 20% inhibition of RCI and ADP/O and 50% inhibition of GI. The values are expressed in mmol/l. Toxicological Studies Nitrophenols are toxic in both vegetables and animals because they interfere with one of the basic cell function, namely energy transduction. • The PHYTOTOXICITY of nitrophenols and nitrocresols was evaluated by determining the reduction in germination of soy seeds for 15 nitrophenols and nitrocresols, measuring the root length after 5 days of exposure and calculating the germination index GI. Then IC50 (mmol/L) values were calculated. • In order to predict the TOXICITY of these relevant compounds ON ANIMALS both the uncoupling activity of the oxidative phosphorylation and the inhibitory effect of oxygen consumption in mitochondria isolated from mouse liver were determined in vitro for 18 available phenol derivatives. The measurement was made using the oxygen electrode. The inhibitory effect of the oxygen consumption was calculated as Respiratory Control Index (RCI) inhibition, while the uncoupling activity was measured as ADP/O ratio reduction. Then IC20(mol/L)values were calculated. • The RESULTS indicate that: • phenol and cresols are not phytotoxic at tested doses, while the nitration products always show some effect. In particular the activity of the dinitroderivates is higher than the corresponding mononitroderivates. • 4,6-DNOC and 2,4-DNP are the most toxic substances on oxidative phosphorilation, they have IC20 less than10M. Generally dinitroderivates are more active than mononitroderivates and prevalently uncouplers. Phenol and cresols practically have no effect on energy transduction cell processes. QSAR Modelling MOLECULAR DESCRIPTORS Molecular descriptors for QSPR modeling were computed using the package DRAGON of Todeschini and Consonni3. The input files for descriptor calculation, containing information on atomic spatial coordinates relative to the minimum energy conformation, were obtained by the molecular mechanics method of Allinger (MM+) using the package HYPERCHEM. A set of about molecular descriptors was used: a) 1D-descriptors:counting of atoms and fragments, MW and sum of atomic properties; b) 2D-descriptors: topological (from molecular graph); c) 3D-descriptors WHIM (Weighted Holistic Invariant Molecular) descriptors4 GETAWAY**, that contain information about the whole 3D-molecular structure in terms of size, symmetry and atom distribution. CHEMOMETRIC MODELS Multiple linear regression analysis and variable selection were performed by the package MOBY DIGS of Todeschini5, using Ordinary Least Squares regression (OLS) and GA-VSS (Genetic Algorithm - Variable Subset Selection). This approach was applied to the whole set of independent variables so as to select the most relevant descriptors giving models with the highest predictive power. All the models were internally validated by the leave-one-out (Q2LOO) and leave-more-out procedure (Q2LMO) and the reliability of the predicted responses verified by the leverage approach. ** in press Phytotoxicity Respiration inhibition RCI Phosphorilation Decoupling ADP/O • References • . Belloli R., Barletta B., Bolzacchini E., Meinardi S., Orlandi M., Rindone B., (1999). Determination of toxic in the atmosphere by high performance liquid chromatography. J Chromatogr. A, 846, 277-281. 2. Herrmann H., (1999). Kinetic of NO3 reaction with phenols, cresols, benzoic acid and their nitration products in aqueous solution and modelling of tropospheric nitration. EC project report UNARO (ENV4-CT97-0411). 3.Todeschini R., Consonni V., (2000). DRAGON – Software for the calculation of molecular descriptors, vers. 1.0. Free download avaible. 4. Todeschini R., Gramatica P., (1997). 3D-modelling and Prediction by WHIM Descriptors. Part 5. Theory Development and Chemical Meaning of Whim Descriptors. Quant. Struct.-Act. Relat. 16, 113-119. 5. Todeschini R., (1999). MOBY DIGS – Software for multilinear regression analysis and variable subset selection by Genetic Algorithm, rel. 2.1 Milano. • IC50 = 8.33 - 0.4 nNO - 21.6 G2v - 6.8 E1p • E1p: WHIM, atomic distribution • G2v: WHIM, simmetry • nNO: number of NO2. groups • IC20= -20.305 + 0.0487 BAC + 0.4759 SPAN + 82.467 G1e • G1e: WHIM, simmetry • SPAN: Geometric, dimension • BAC: Topological, centric index of Balaban. • IC20= -11.86 + 0.272 As + 21.78 Ks – 15.37 ASP • Ks: WHIM, shape • As: WHIM, dimension • ASP: Geometrical, sphericity