Download
1 / 23
230 likes | 444 Vues
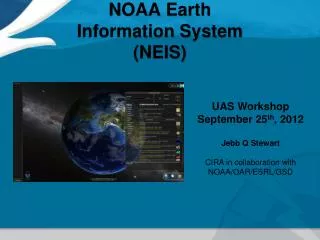
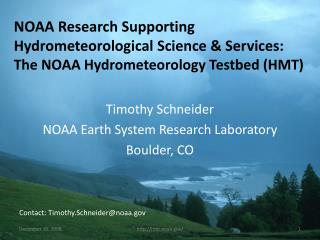
NOAA Research Supporting Hydrometeorological Science & Services: The NOAA Hydrometeorology Testbed (HMT). Timothy Schneider NOAA Earth System Research Laboratory Boulder, CO. Contact: Timothy.Schneider@noaa.gov. Outline. An Introduction to HMT An HMT Requirement Observations Modeling

E N D
NOAA Research Supporting Hydrometeorological Science & Services: The NOAA Hydrometeorology Testbed (HMT) Timothy Schneider NOAA Earth System Research Laboratory Boulder, CO Contact: Timothy.Schneider@noaa.gov http://hmt.noaa.gov/
Outline • An Introduction to HMT • An HMT Requirement • Observations • Modeling • Research to Operations Projects • An Underlying Principle: Atmospheric Rivers • A Broader Context: Integrated Water Resource Services http://hmt.noaa.gov/
I. An Introduction to HMT http://hmt.noaa.gov/
Marty Ralph NOAA/HMT Building Partnerships • A critical element: engaging local, state and federal stakeholders… • Will evolve as HMT evolves: • Smaller panel with national scope • Form Regional Implementation Teams http://hmt.noaa.gov/
HMT: A National Testbed Strategy with Regional Implementation HMT WEST - Cool Season Major Activity Areas • Quantitative Precipitation Estimation (QPE) • Quantitative Precipitation Forecasts (QPF) • Snow level and snow pack • Hydrologic Applications & Surface Processes • Verification & Decision Support Tools • Enhancing & Accelerating Research to Operations • Building partnerships HMT Southeast – All Season, Including Hurricane Landfall HMT “Next” (TBD) • Dabberdt et. al., 2005: Multifunctional Mesoscale Observing Networks, BAMS, pp. 961-982 • Ralph et. al., 2005: Improving Short-Term (0–48 h) Cool-Season Quantitative Precipitation Forecasting Recommendations from a USWRP Workshop, BAMS, pp. 1619-1632 http://hmt.noaa.gov/
Hydrometeorology Testbed Timeline Regions of Focus Key U.S. Watershed Tar-Neuse River Basins West Coast/Russian River American River Analysis HMT-Southeast HMT-West HMT-Next Proof of concept Level of effort / activity CalWater Caljet Pacjet ^ HMT Prototype Field Work EFREP HMT-SE Legacy HMT-West Legacy Fiscal Year NOAA Hydrology Program (Water Resources Data Assimilation) NOAA Science and Technology Infusion Program (Hydrometeorology Testbed) http://hmt.noaa.gov/
II. An HMT Requirement http://hmt.noaa.gov/
Water Management Section, Sacramento District, US Army Corps of Engineers A Water Resource Driver(One Example) • Societal Need: Reservoir operators and water managers need to balance demands for flood control and water supply • They can achieve this through forecast-based operational techniques are being developed by reservoir operators • Stu Townsley: • “NOAA products are essential to Corps flood risk reduction mission” • “The Corps supports forecast product enhancement” http://hmt.noaa.gov/
HMT Requirement:Produce accurate 0-120 hour+ forecasts of extreme precipitation (NWS) to enable forecast-based water resource management • Subseasonal Forecasting (Weickman & Berry): • global synoptic dynamic model (GSDM) QPF: 5-14 days Observations Assimilatoin & Downscaling (e.g. PRISM) • Reforecasting (Hamill & Whitaker): • probabilistic • downscaling • analogues for various fields QPF: 3-5 days QPF: 0-3 days • Deterministic Forecasts (McGinley et. al.): • high resolution • ensembles NowCast: QPE->24 hrs.(?) http://hmt.noaa.gov/
III. Research to Operations Projects http://hmt.noaa.gov/
A New Paradigm for Understanding West Coast Storms: Atmospheric Rivers http://hmt.noaa.gov/
Research to Operations Projects • High-resolution ensemble QPF/PQPF • Ensemble means • Probabilistic fields • Moisture Flux Tools • GPSMet Grids • Moisture Flux Verification Tool • Snow Information Tools • Gridded snow level from Q2/NMQ • Point verification; model bias correction • Atmospheric River (AR) ToolsPacific Atmospheric River Threat Indicator, “PARTI” • Water Vapor Flux Anomaly • Observational-based AR intensity • Reforecasting products (NWP) • *HMT Mini-Workshop on FFMP; Boulder, CO, November 2008 http://hmt.noaa.gov/
Research to Operations Projects • FFMP Alpha Tests • Water vapor flux tools: Guidance • QPE bias correction • QPF Grids • EFREP: An HMT Legacy • Network of Snow-level Radars • Enhanced GPSMet Network • Enhanced Soil Moisture Network • Dedicated High-resolution ensemble modeling system • Decision Support Tools and Advanced Display System (ALPS) • *HMT Mini-Workshop on FFMP; Boulder, CO, November 2008 http://hmt.noaa.gov/
IV. A Broader Context: Integrated Water Resource Services http://hmt.noaa.gov/
NOAA Integrated Water Resource Services • Priority Area Task Team: FY 2009 Activities • Too Little Water: National Integrated Drought Information System • Too Much Water: Hydrometeorology Testbed • West • Carry out winter season field operations for the Carson and American River basins • Deploy advanced observational technology to support NOAA/USGS Debris Flow Warning pilots for San Diego, Los Angeles, and Monterey Bay areas • Soil moisture demonstration for monsoon season flash flood support in San Pedro Basin in Southern AZ • Southeast • Conduct two workshops to identify operational needs and research priorities • Develop project implementation plan for Tar/Neuse watersheds • Water Quality (Delaware River Basin/Estuary & Great Lakes • Coast Estuary River Information System (CERIS) & Coastal and Inland Flooding Observation and Warning (CI-FLOW) http://hmt.noaa.gov/
Towards An Integrated Approach • NOAA Integrated Water Resource Services • Hydrometeorology Testbed (HMT) Southeast • Deploy and install advanced observing systems • Conduct intensive observational periods • Initiate research projects • Transition tools/findings into NWS operations • Coastal-Estuary-River Information System (CERIS) Implementation (Tar/Neuse/Pamlico) • CI-FLOW Demonstration (Sea Grant Sponsored R&D Effort) • Provide routine access to HMT Southeast data • Migrate coupled water forecasting system to NOAA operations • Develop, deliver, evaluate and enhance new products and services • THORPEX • Medium Range QPF research supporting HMT • Ensemble numerical modeling for QPF • Strengthens University partner engagement http://hmt.noaa.gov/
Thank You! Backup Slides Contact: Timothy.Schneider@noaa.gov http://hmt.noaa.gov/
Performance measures for “service” programs (e.g., LFW) Performance measures for ST&I (an enabling program) Linking Science, Technology & Infusion Performance Measures to NOAA GPRA Measures Today’s predictive services exist on a foundation of earlier innovation in science and technology Service GPRA (e.g., QPF) Demonstration GPRAs in Testbeds “Infusion” Performance Measures “Science” Performance Measures “Technology” Performance Measures http://hmt.noaa.gov/
snow rain On Developing a Performance Measure for Snow Level Forecasts • HMT introduced a real-time, wind profiler-derived, snow-level product that is updated hourly on the internet. • This new capability prompted NWS staff at the CNRFC to ask ESRL to quantify operational snow level forecast performance. • Lundquist et al. (2008) in J. Hydrometeor. documented the relationship to snow at ground level • 15% of the freezing level forecast errors were greater than +/- 1,000 ft. • When predicted snow level is below what is observed, this translates to underestimates in stream flow, e.g., a 2,000 ft snow-level error can cause a factor of 3 runoff error (White et al., J. Tech. 2002) Results courtesy of Dr. Allen White and Dan Gottas (ESRL/PSD)
NWS California-Nevada River Forecast Center On Developing a Performance Measure for Forecasting Extreme Precipitation • HMT has worked with forecast users to identify critical needs for extreme event prediction. • The existing performance measure for QPF (1 inch “threat score”) does not address this need. • 17 sites were used to assess QPF performance for events exceeding 1 inch, 3 inches, and 5 inches in 24 hours, at 1, 2 and 3-day lead times. • Prototype QPF performance measures for • extreme precipitation events are being developed • and baselines are being created by HMT • Probability of Detecting (Forecasting) a >5 inch event • Bias of QPF in events with >5 inches rain observed • Of 16 events with >5 inches in 24 hours, the QPF bias was low • 0.71 (1-day lead) • 0.60 (2-day lead) • 0.51 (3-day lead) • Of 16 events with >5 inches of rain in 24 h, 2 were predicted 1 day ahead - 5 inch POD = 0.06
Marty Ralph NOAA/HMT The HMT ConceptTestbed as a Process • HMT is about “too much water”… • But is intertwined with broader water resource management, climate & drought issues • Objectives: • To advance our understanding, monitoring and prediction of processes leading to extreme precipitation and associated flooding • To demonstrate and evaluate new research and technology through a national strategy employing regional testbeds • To accelerate and enhance research to operations http://hmt.noaa.gov/