Download
1 / 12
120 likes | 255 Vues
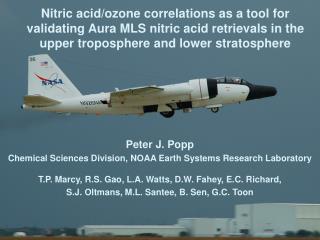
Nitric acid/ozone correlations as a tool for validating Aura MLS nitric acid retrievals in the upper troposphere and lower stratosphere. Peter J. Popp Chemical Sciences Division, NOAA Earth Systems Research Laboratory T.P. Marcy, R.S. Gao, L.A. Watts, D.W. Fahey, E.C. Richard,

E N D
Nitric acid/ozone correlations as a tool for validating Aura MLS nitric acid retrievals in the upper troposphere and lower stratosphere Peter J. Popp Chemical Sciences Division, NOAA Earth Systems Research Laboratory T.P. Marcy, R.S. Gao, L.A. Watts, D.W. Fahey, E.C. Richard, S.J. Oltmans, M.L. Santee, B. Sen, G.C. Toon
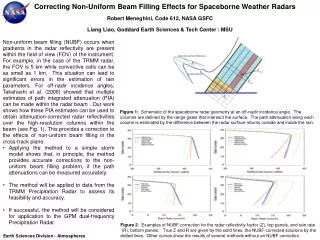
• Two independent channels of detection allow us to measure both gas- and particle-phase HNO3 Precision: 40 pptv (1 at 1 second) Accuracy: 25% • NOAA CIMS instrument Direction of Flight SF5- + HNO3 SF4 + HFNO3- Forward-facing Inlet (Particle + gas phase) Downward-facing Inlet (Gas phase only)
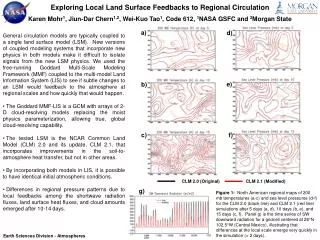
Nitric acid/ozone correlation in the UT/LSAVE-Houston June 2005 10-s averages of NOAA CIMS and ozone photometer data 19-43° N Latitude
Nitric acid/ozone correlation in the UT/LSAVE-Houston June 2005
Calculating proxy nitric acid AVE-Houston June 2005 10-s averages HNO3 = 0.00295·O3 - 0.170 19-43° N Latitude
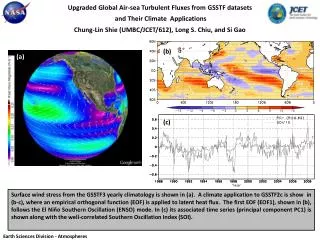
Using proxy nitric acid to calculate NAT saturation conditions in the tropics Pre-AVE Costa Rica January 2004 Ozone and temperature: San Cristobal (1° S) and Paramaribo (6° N) Water vapor: San Cristobal (1° S) and San Jose (10° N) In situ NAT particle observations 80 hPa NAT saturated region Popp et al., 2006
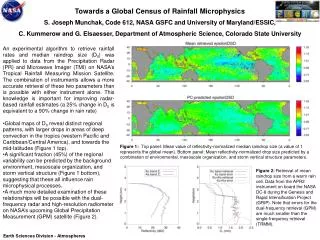
Vertical profiles of nitric acid in the tropicsPre-AVE Costa Rica January 2005 In situ measurements during the Aura validation campaigns revealed extremely low HNO3 mixing ratios (<100 pptv) near the tropical tropopause
Conclusions • HNO3 and O3 exhibit a robust and compact correlation in the lower stratosphere Strong latitudinal gradients are observed in the correlation slope HNO3/O3 correlations are a useful tool for the validation of HNO3 retrievals, particularly when comparing different measurement techniques. Proxy HNO3 mixing ratios derived from the HNO3/O3 correlation expand the range of available HNO3 comparisons when only O3 data are available Comparisons between the HNO3/O3 correlations derived from MLS, MkIV and NOAA in situ instruments onboard the WB-57F show acceptable agreement at the 68 and 100 hPa retrieval levels • • •