Download
1 / 8
80 likes | 203 Vues
The Hurricane and Severe Storm Sentinel (HS3)—Initial Findings From 2012 Scott Braun & Paul Newman, NASA GSFC. Goal: To examine the processes (environmental vs. internal) that control hurricane intensification.

E N D
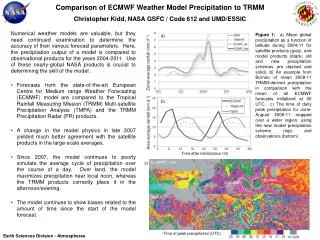
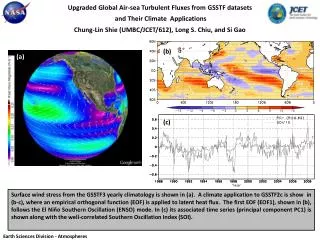
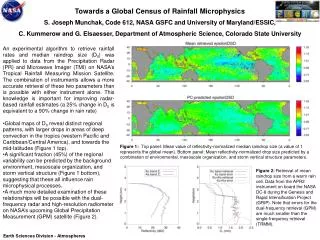
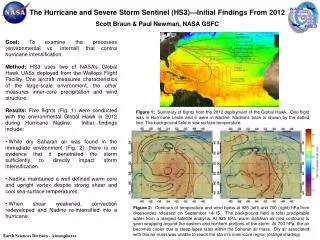
The Hurricane and Severe Storm Sentinel (HS3)—Initial Findings From 2012Scott Braun & Paul Newman, NASA GSFC • Goal: To examine the processes (environmental vs. internal) that control hurricane intensification. • Method: HS3 uses two of NASA’s Global Hawk UASs deployed from the Wallops Flight Facility. One aircraft measures characteristics of the large-scale environment, the other measures inner-core precipitation and wind structure. • Results: Five flights (Fig. 1) were conducted with the environmental Global Hawk in 2012 during Hurricane Nadine. Initial findings include: • While dry Saharan air was found in the immediate environment (Fig. 2), there is no evidence that it penetrated the storm sufficiently to directly impact storm intensification. • Nadine maintained a well defined warm core and upright vortex despite strong shear and cool sea-surface temperatures. • When shear weakened, convection redeveloped and Nadine re-intensified into a hurricane. Figure 1:Summary of flights from the 2012 deployment of the Global Hawk. One flight was in Hurricane Leslie and 5 were in Nadine. Nadine’s track is shown by the dotted line. The background field is sea-surface temperature. Figure 2:Contours of temperature and wind barbs at 925 (left) and 700 (right) hPa from dropsondes released on September 14-15. The background field is total precipitable water from a merged satellite analysis. At 925 hPa, warm Saharan air (red contours) is seen wrapping around the eastern and northern portions of the storm. At 700 hPa, the air becomes cooler due to steep lapse rates within the Saharan air mass. Dry air associated with this air mass was unable to reach the storm’s inner-core region (orange shading). Earth Sciences Division - Atmospheres
Name: Scott Braun, NASA/GSFC, Code 612 E-mail: scott.a.braun@nasa.gov Phone: 301-614-6316 Data Sources: The goal of the mission is to improve understanding of the processes that control hurricane formation and intensity change and to determine better the relative roles of the large-scale environment and smaller-scale processes in the inner-core region of storms (i.e., the eyewall and rainbands). One GH (designated the environmental GH) is designed to sample temperature, humidity, winds, and Saharan dust in the storm environment while the other (designated the over-storm GH) is focused on measuring winds and precipitation within the storm. All data are from the 2012 HS3 campaign using the environmental Global Hawk only. Instruments included the Cloud Physics Lidar (CPL, NASA/GSFC), the Scanning High-resolution Interferometer Sounder (S-HIS, Univ. of Wisconsin), and the Advanced Vertical Atmospheric Profiling System (AVAPS, NOAA/NCAR). Flights in 2012 included a transect of the outflow layer of Hurricane Leslie during the transit from Dryden to Wallops and five flights into Hurricane Nadine beginning during its initial formation into a tropical storm (Sept. 11-12), development into a hurricane (Sept. 14-15), weakening to a tropical storm (Sept. 19-20), re-intensification to a tropical storm (Sept. 22-23, after the hurricane center had declared it to be “post” tropical), and then the onset of intensification back into a hurricane (Sept. 26-27). Technical Description of Figures: Figure 1: Summary of flights from the 2012 deployment of the Global Hawk. Flight tracks for each flight are shown. One flight was in Hurricane Leslie and 5 were in Nadine. Nadine’s track is shown by the dotted line. The background field is sea-surface temperature with warmer temperatures (>26°C) indicated by yellow and orange colors, cooler temperatures (< 26°C) indicated by green and blue colors. Figure 2: Contours of temperature and wind barbs at 925 (left) and 700 (right) hPa from dropsondes released on September 14-15. The background field is total precipitable water from a merged satellite analysis. At 925 hPa, warm Saharan air (≥ 23°C, red contours) is seen wrapping around the eastern and northern portions of the storm. At 700 hPa, the air becomes cooler (≤ 7°C) due to steep lapse rates within the Saharan air mass. Dry air was associated with this air mass and was unable to reach the storm’s inner-core region (orange shading). Dry air was observed to wrap into the circulation at higher levels above the Saharan air (> 600 hPa) and was likely associated with strong subsidence on the upshear side of the storm. Scientific significance: There is frequent debate within the hurricane research and operational communities about the impact of Saharan air, with some treating it as a major suppressor of hurricane formation and intensification, and others holding that it is very difficult for the dry air to get into the circulation in such a way as to impact intensity. Observations needed to evaluate this process have been difficult to obtain previously, but the Global Hawk provides a new capability for mapping out large regions of the storm and its environment. Relevance for future science and relationship to Decadal Survey: This work provides a significant set of observations for understanding how Saharan air impacts developing storms and can provide important information for the analysis of data in hurricanes from satellite data such as from TRMM, Aqua, CALIPSO, and NPP. Earth Sciences Division - Atmospheres
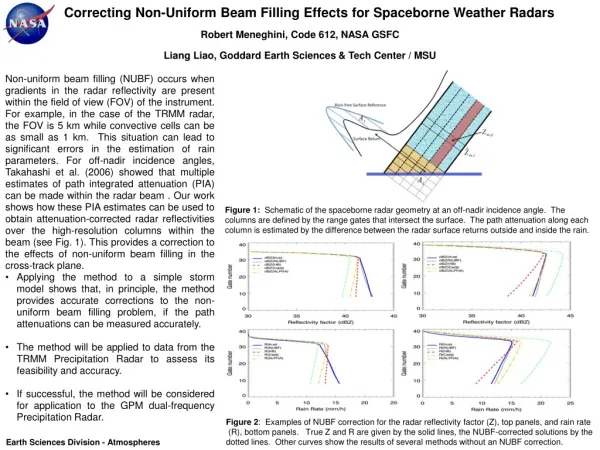
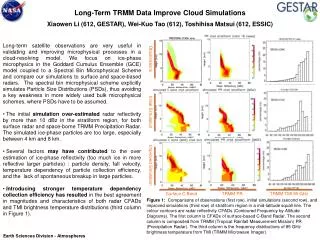
Improving Precipitation Forecasts with a New Data Assimilation System Sara Q. Zhang (SAIC), Arthur Y. Hou, and Xin Lin (GEST), Code 612, NASA GSFC • It is a scientific challenge to effectively utilize remotely-sensed precipitation observations in numerical weather prediction (NWP) systems to improve precipitation forecasts and extend prediction capabilities in hydrological applications. A state-of-art ensemble data assimilation system, the Goddard WRF-EDAS, has been developed with a focus on assimilation of precipitation-affected microwave radiances at cloud-resolving scales. • Microwave radiances from TRMM TMI and AMSR-E are assimilated to evaluate the system performance and assess the data impact to precipitation forecasts. • Forecasts are validated against independent precipitation observations from a ground-based radar network. • Ensemble assimilation of precipitation-affected radiances improves the quality of precipitation forecasts in terms of spatial distribution and intensity in accumulated surface rainfall in flooding regions. Figure 1: observing precipitation process: a storm in southeast US, 1800 UTC September 2009. (1) microwave radiances from TMI 85 GHz channel, (2) surface rainfall from NOAA ground-based radar data (Stage IV), and (3) Scattering index over land (SIL) calculated from TMI microwave channels of 19, 21, and 85 GHz. Figure 2: improving precipitation forecast: surface rainfall accumulation during a flooding in southeast US, 15-22 September, 2009.(1) verification data from radar network, (2) forecast without assimilation of precipitation-affected radiances, and (3) forecast with assimilation of precipitation-affected radiances from TMI and AMSR-E high frequency channels using ensemble Kalman filter technique. Earth Sciences Division - Atmospheres
Name: Sara Q. Zhang, NASA/GSFC, Code 612 E-mail: sara.q.zhang@nasa.gov Phone: 301-614-6148 References: Zhang, S.Q., M. Zupanski, A. Y. Hou, X. Lin, and S. H. Cheung, 2013: Assimilation of precipitation-affected radiance in a cloud-resolving WRF ensemble data assimilation system, Monthly Weather Review, in press. On-line release, doi: http://dx.doi.org/10.1175/MWR-D-12-00055.1 Technical Description of Figures: Figure 1:observing precipitation process: a storm in southeast US, 1800 UTC September 2009.(1) microwave radiances from TMI 85 GHz channel, (2) surface rainfall from NOAA ground-based radar data (Stage IV), and (3) Scattering index over land (SIL) calculated from TMI microwave channels of 19, 21, and 85 GHz. It is evident that the microwave brightness temperature depression shown in panel (1) correlates highly with the surface rainfall observed by ground-based radar network depicted in panel (2). The Scattering Index over Land (SIL) shown in panel (3) is used in rain pixel identification and observation error modelling in Goddard WRF-EDAS. Figure 2:improving precipitation forecast: surface rainfall accumulation during a flooding in southeast US, 15-22 September, 2009.(1) verification data from radar network, (2) forecast without assimilation of precipitation-affected radiances, and (3) forecast with assimilation of precipitation-affected radiances from TMI and AMSR-E high frequency channels using ensemble Kalman filter technique. Clouds and precipitation produced by the high-resolution cloud model are included in control variables, ensemble forecasts are used to estimate flow-dependent forecast error covariance. Scientific significance: In most current numerical weather prediction (NWP) systems, over 75% of satellite observations are not used due to complicated effect of clouds and precipitation to radiance signals. This work establishes the viability of a cloud-scale ensemble data assimilation system capable of effectively assimilating precipitation-affected radiances with flow-dependent forecast error covariance, non-linear observation operators and microphysical variables in the control vector. Relevance for future science and relationship to Decadal Survey: The ensemble data assimilation for satellite precipitation observations provides an vehicle for optimal utilization of satellite satellite precipitation information at cloud-resolving scales for climate reanalysis and hydrological applications. Earth Sciences Division - Atmospheres
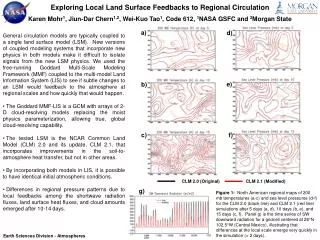
Hemispheric Impacts of Regional Anthropogenic Emissions of Aerosols Hongbin Yu (ESSIC, University of Maryland and NASA GSFC Code 613) Anthropogenic aerosols make significant contributions to the global mean radiative forcing (RF) of climate. It is necessary from a scientific perspective to assess how emission changes influence the aerosol radiative forcing. Because of the compelling evidence of aerosol intercontinental transport (ICT) as provided by satellite measurements (Yu et al., 2012), regional emission reductions could have far reaching impacts on RF in downwind regions/continents. Under the auspices of the United Nations Economic Commission for Europe, a Task Force on Hemispheric Transport of Air Pollution (HTAP) was established in 2005. TF HTAP has organized a comprehensive international assessment activity of the ICT of air pollution in Northern Hemisphere that involved multiple modeling studies on source attribution and source-receptor relationships (HTAP, 2010). We used an ensemble of 9 HTAP global models to assess the change of global and regional aerosol optical depth (AOD) and direct RF in response to the 20% reductions of anthropogenic emissions from four major polluted regions in the Northern Hemisphere and the role of ICT (Yu et al., 2013). As shown in Figure 1, emissions for the polluted regions exert significant forcing on intercontinental and even hemispheric scales. We found that although local emissions remain the main contributor in the four regions, the import via ICT is significant, with a percentage contribution of the import ranging from 11 5 to 31 9%. In particular, North America is substantially influenced by the import of black carbon (BC) from East Asia, while South Asia is substantially influenced by the import of sulfate from Europe (Figure 2). Our multi-model assessment shows large differences between models, which highlights a need for improving the representation of aerosol processes in models and developing observational databases for evaluating and constraining models. Fig. 1. HTAP multi-model median perturbations of annual average all-sky surface direct radiative forcing due to 20% reductions of anthropogenic aerosol emissions in four major polluted regions (marked as red boxes) in Northern Hemisphere, namely North America (NA), Europe (EU), East Asia (EA), and South Asia (SA). Fig. 2. Percentage contributions of individual source regions to AOD changes of BC (top panel) and sulfate (bottom panel) in the receptor regions (x-axis) based on the HTAP multi-model average. Earth Sciences Division - Atmospheres
Name: Hongbin Yu, ESSIC, University of Maryland and NASA/GSFC, Code 613 E-mail: Hongbin.Yu@nasa.gov Phone: 301-614-6209 References: Yu, H., M. Chin, J. West, C. S. Atherton, N. Bellouin, I. Bey, D. Bergmann, Bian. H., Diehl, T., G. Forberth, P. Hess, M. Schulz, D. Shindell, T. Takemura, and Q. Tan (2013). A multi-model assessment of the influence of regional anthropogenic emission reductions on aerosol direct radiative forcing and the role of intercontinental transport. J. Geophys., Res., doi:10.1029/2012JD018148, In Press. Yu, H., L.A. Remer, M. Chin, H. Bian, Q. Tan, T. Yuan and Y. Zhang (2012). Aerosols from overseas rival domestic emissions over North America, Science, 337, 566-569, doi:10.1126/science.1217576. HTAP (2010), Hemispheric Transport of Air Pollution 2010 - Part A: Ozone and Particulate Matter, Air Pollution Studies No. 17, edited by Frank Dentener, Terry Keating, and Hajime Akimoto, United Nations, New York and Geneva. (http://www.htap.org/) Data Sources: HTAP multi-model simulations of source-receptor relationships for anthropogenic aerosols. In these experiments, anthropogenic emissions in four major polluted regions in Northern Hemisphere were reduced by 20%. The models used in this study include three NASA models, namely GOCART, GMI, and GISS-PUCCINI. Technical Description of Figures: Figure 1: HTAP multi-model median perturbations of annual average surface direct radiative forcing due to 20% reductions of anthropogenic aerosol emissions in four major polluted regions (marked as red boxes) in Northern Hemisphere, namely North America (NA), Europe (EU), East Asia (EA), and South Asia (SA). The aerosol components considered here include sulfate, particulate organic matter, and black carbon (BC). For forcing calculations, external mixing of these components is assumed. Figure 2: Percentage contributions of individual source regions to AOD changes of BC (top panel) and sulfate (bottom panel) in the receptor regions (x-axis) based on the HTAP multi-model average. ScientificSignificance: Aerosols remain a wild card in climate change science because they can influence climate in several ways, and our current understanding is far from complete. It is necessary from a scientific perspective to assess how emission changes influence the aerosol radiative forcing. Extraregional emissions could also be of particular importance for formulating an effective strategy for mitigating regional climate change and combating air pollution. The result from this study shows that the import from intercontinental transport is significant, although local emissions remain the main contributor. Relevance for future science and relationship to Decadal Survey: The multi-model assessment shows large differences between models in the impacts of emission reduction and the role of intercontinental transport, which highlights a need for improving the representation of model physical and chemical processes. It is also essential to develop observational databases for evaluating and constraining models. Satellites should make important contributions in this aspect. Satellite observations acquired in the EOS-era have transformed the perspective of aerosol intercontinental transport from qualitative tracking to quantitative characterization. Future satellite missions as recommended by the Decadal Survey could further enhance the satellite capabilities, such as more accurate measurements of particle properties by ACE and high temporal-resolution measurements of aerosol by GEO-CAPE. Earth Sciences Division - Atmospheres
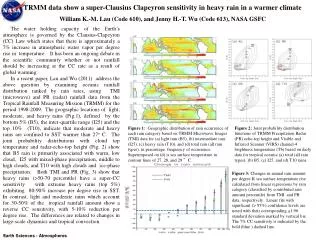
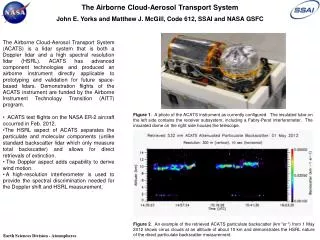
High Spatial Resolution Trace-gas Measurement Results from ACAM during DISCOVER-AQScott J. Janz, Code 614, NASA GSFC The Airborne Compact Atmospheric Mapper (ACAM) is designed to measure gases in the atmosphere that are important in understanding air quality and the chemistry of pollution events. The instrument has recently flown onboard the NASA Langley Research Center’s King Air aircraft in support of the DISCOVER-AQ program [Deriving Information on Surface Conditions from COlumn and VERtically Resolved Observations Relevant to Air Quality ] The instrument views sunlight that is back-scattered from the atmosphere below the aircraft and can determine the abundance of trace-gas molecules in it’s field of view by examining the absorption features in the measured spectrum. The high spatial resolution of the measurements allows us to correlate our values with both ground-based and other airborne “point” or in-situ measurements, and larger area satellite based mapping instruments. We’ve found that particularly for NO2, the satellite measurements can miss large horizontal gradients in the trace-gas distribution making it difficult to validate those measurements against ground-based observations in polluted areas. However, by careful registration of the ACAM measurements to both the ground and satellite instruments, we can transfer the in-situ measurements to the satellite. Figure 1: Example of one of the daily datasets available from the ACAM instrument. The figure shows measurements of the column amounts below the aircraft of nitrogen dioxide (NO2) in the Washington DC area from July of 2011. The contrast in NO2 between the heavily populated Washington-Baltimore corridor and more rural areas in Maryland can be readily seen in this figure. Figure 2: A Comparisons of formaldehyde (CH2O) with in-situ and satellite instruments. The plot shows good agreement with instrumentation that samples the vertical profile of the trace gas at different aircraft altitudes and an offset with respect to the OMI instrument. With ACAM we can attempt to tie the various sampling modes together to better understand and improve the algorithms that produce the remote-sensing products. Earth Sciences Division - Atmospheres
Name: Scott Janz, NASA/GSFC, Code 614 E-mail: scott.janz@nasa.gov Phone: 301-614-5987 References: Kowalewski, M.G. and S.J. Janz, 2010: Remote Sensing Capabilities of the Airborne Compact Atmospheric Mapper, Proc. SPIE, 7452. Bucsela, E.J., E.A Celarier, M.O. Wenig, J.F. Gleason, J.F., J.P. Veefkind, K.F. Boersma, K.F.; E.J. Brinksma, 2006: Algorithm for NO2 vertical column retrieval from the ozone monitoring instrument, IEEE Trans. On Geoscience and Remote Sensing, 44(5), 1245 – 1258 Formaldehyde data from the Difference Frequency Generation Absorption Spectrometer(DFGAS) courtesy of Dr. Alan Fried Weibring, P., D. Richter, A. Fried, J.G. Walega, and C. Dyroff, 2006: Ultra-High-Precision Mid-IR Spectrometer II: System Description and Spectroscopic Performance, Appl. Phys. B Data Sources: DISCOVER-AQ , MODIS high resolution albedo product, AURA-OMI Technical Description of Figures:Slant column NO2 values gridded to 1km x 1km resolution over the observation area are shown in Figure 1 . The cross-track swath is approximately 7 km wide and multiple passes over the observation area have been averaged for the entire day. In order to perform absolute comparisons to other instrumentation, these slant columns must be converted to vertical columns via radiative transfer corrections to account for enhancements to the absorption caused by viewing geometry, surface albedo, and the vertical profile of the trace gases. Algorithms to perform these corrections were provided by Nickolay Krotkov and Lok Lamsal of code 614 and leverage heavily off of the work done by the Laboratory in developing similar algorithms for OMI. More recent measurements (not shown) from the San Juaquin Valley in CA from January 2013 show hot spots around Fresno to the north and Bakersfield to the south and the conversion algorithms for these data will have to account for the much different aerosol characteristics in this area compared to the previous campaign. Once converted, the comparisons shown in Figure 2 can be performed. In this figure spatial and temporal coincidences are found between ACAM vertical column values of CH2O at 1x1 km^2 sample spacing with the DFGAS instrument flown aboard the P3-B and the OMI instrument on AURA. Both ACAM and DFGAS show a general build-up of CH2O over the area (and the Beltsville site in particular) from morning to afternoon. The OMI overpass measurements at 13:30 local time are also shown and are significantly higher than either of the other instruments. Other comparisons have been performed as well, including a comparison between ACAM and OMI measurements of NO2 showing very good agreement once the the differences in spatial sampling are accounted for. Scientific significance: The work here is most closely linked with future geostationary chemistry measurements needed to make the connection between local and global-scale processes. Current process understanding from satellite remote sensing is based on low earth orbit (LEO) measurements, which afford one sample per day at a given location in mid latitudes (often obscured by clouds). Key processes, however, occur on relatively short time scales, e.g., dispersal of point emissions, diurnal photochemistry, planetary boundary layer growth and decay that are not accessible from LEO observations. The ability to scan regions of interest continuously at high frequency (e.g., hourly) and high spatial resolution from geostationary orbit promises to revolutionize our ability to characterize the processes linking global atmospheric composition to local pollution. Relevance for future science and relationship to Decadal Survey: NASA HQ has been supporting the pre-phase-A mission concept planning for the decadal survey recommended GEO-CAPE mission, and this work feeds directly into these activities. Code 614 scientists are involved in the atmospheric science advisory committee for GEO-CAPE in developing and improving trace-gas measurements and algorithms. The measurements highlighted here and availability of an airborne test platform is a valuable tool for these efforts. Earth Sciences Division - Atmospheres