Chapter 9 Hypothesis Testing
Chapter 9 Hypothesis Testing. Introduction to Statistical Tests Testing the Mean µ Testing a Proportion p Tests Involving Paired Differences Testing µ1-µ2 and p1-p2. 9.1 Introduction to Statistical Tests. We can draw inference on a population parameter in two ways: Estimation (Chapter 8)

Chapter 9 Hypothesis Testing
E N D
Presentation Transcript
Chapter 9 Hypothesis Testing • Introduction to Statistical Tests • Testing the Mean µ • Testing a Proportion p • Tests Involving Paired Differences • Testing µ1-µ2 and p1-p2
9.1 Introduction to Statistical Tests We can draw inference on a population parameter in two ways: Estimation (Chapter 8) Hypothesis Testing (Chapter 9)
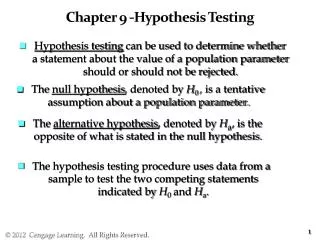
Hypothesis Testing In essence, hypothesis testing is the process of making decisions about the value of a population parameter.
Establishing the Hypotheses Null Hypothesis: A hypothesis about the parameter in question that often denotes a theoretical value, an historical value, or a production specification. Denoted as H0 Alternate Hypothesis: A hypothesis that differs from the null hypothesis, such that if we reject the null hypothesis, we will accept the alternate hypothesis. Denoted as H1 (in other sources HA).
Example A car manufacturer advertises that its new subcompact models get 47 miles per gallon (mpg). Let µ be the mean of the mileage distribution for these cars. You assume that the manufacturer will not underrate the car, but you suspect that the mileage might be overrated. (a) What shall we use for H0? (b) What shall we use for H1?
Types of Tests The null hypothesis is always a statement of equality. H0: μ = k, where k is a specified value The alternate hypothesis states that the parameter (μ, p) is less than, greater than, or not equal to a specified value.
Types of Tests Left-Tailed Tests: H1: μ < k H1: p < k Right-Tailed Tests: H1: μ > k H1: p > k Two-Tailed Tests: H1: μ≠ k H1: p ≠ k
Hypothesis Testing Procedure Select appropriate hypotheses. Draw a random sample. Calculate the test statistic. Assess the compatibility of the test statistic with H0. Make a conclusion in the context of the problem.
Example Rosie is an aging sheep dog in Montana who get regular check-ups from her owner, the local veterinarian. Let x be a random variable that represents Rosie’s resting heart rate (in beats per minute). From past experience, the vet knows that x has a normal distribution with σ=12. The vet checked the Merck Veterinary Manual and found that for dogs of this breed, µ=115 beats per minute. Over the past six weeks, Rosie’s heart rate (beats/min) measured 93 109 110 89 112 117 The sample mean is =105. The vet is concerned that Rosie’s heart rate may be slowing. Do the data indicate that this is the case?
P-Value P-values are sometimes called the probability of chance. Low P-values are a good indication that your test results are not due to chance.
Types of Errors in Statistical Testing Since we are making decisions with incomplete information (sample data), we can make the wrong conclusion!! Type I Error: Rejecting the null hypothesis when the null hypothesis is true. Type II Error: Accepting the null hypothesis when the null hypothesis is false.
Errors in Statistical Testing Unfortunately, we usually will not know when we have made an error!! We can only talk about the probability of making an error. Decreasing the probability of making a type I error will increase the probability of making a type II error (and vice versa). We can only decrease the probability of both types of errors by increasing the sample size (obtain more information), but this may not be feasible in practice.
Level of Significance Good practice is to specify in advance the level of type I error we are willing to risk. The probability of type I error is the level of significance for the test, denoted by α (alpha).
Type II Error The probability of making a type II error is denoted by β (Beta). 1 – β is called the power of the test. 1 – β is the probability of rejecting H0 when H0 is false (a correct decision).
Concluding a Statistical Test For our purposes, significant is defined as follows: At our predetermined α level of risk, the evidence against H0 is sufficient to discredit H0. Thus we adopt H1.
Statistical Testing Comments In most statistical applications, α = 0.05 or α = 0.01 is used When we “accept” the null hypothesis, we are not proving the null hypothesis to be true. We are only saying that the sample evidence is not strong enough to justify the rejection of the null Some statisticians prefer to say “fail to reject the null” rather than “accept the null.”
Testing µ When σ is Known State the null hypothesis, alternate hypothesis, and level of significance. If x is normally distributed, any sample size will suffice. If not, n ≥ 30 is required. Calculate:
Testing µ When σ is Known Use the standard normal table and the type of test (one or two-tailed) to determine the P-value. Make a statistical conclusion: If P-value ≤ α, reject H0. If P-value > α, do not reject H0. Make a context-specific conclusion.
Example The Environmental Protection Agency has been studying Miller Creek regarding ammonia nitrogen concentration. For many years, the concentration has been 2.3 mg/l. However, a new golf course and housing developments are raising concern that the concentration may have changed because of lawn fertilizer. Any change (either an increase or a decrease) in the ammonia nitrogen concentration can affect plant and animal life in and around the creek (Reference: EPA Report 832-R-93-005). Let X bea random variable representing ammonia nitrogen concentration (in mg/l). Based on recent studies of Miller Creek, we may assume that xhas a normal distribution with σ=0.3. Recently, a
random sample of eight water tests from the creek gave the following xvalues 2.1 2.5 2.2 2.8 3.0 2.2 2.4 2.9 The sample mean is =2.51 Let us construct a statistical test to examine the claim that the concentration of ammonia nitrogen has changed from 2.3 mg/l. Use level of significance α =0.01 • What is the null hypothesis? What is the alternate hypothesis? What is the level of significance? • Is this a right-tailed, left-tailed, or two-tailed test?
Example (c) What is the sample test statistic? Convert the sample mean to a standard z value. (d) Draw a sketch showing the P-value area on the standard normal distribution. Find the P-value (e) Compare the level of significance and the P-value. What is your conclusion?
9.2 Testing µ When σ is Unknown State the null hypothesis, alternate hypothesis, and level of significance. If x is normally distributed (or mound-shaped), any sample size will suffice. If not, n ≥ 30 is required. Calculate:
Testing µ When σ is Unknown Use the Student’s t table and the type of test (one or two-tailed) to determine (or estimate) the P-value. Make a statistical conclusion: If P-value ≤ α, reject H0. If P-value > α, do not reject H0. Make a context-specific conclusion.
Using Table 6 to Estimate P-Values Suppose we calculate t = 2.22 for a one-tailed test from a sample size of 6. Thus, df = n – 1 = 5. We obtain: 0.025 < P-Value < 0.050
Testing µ Using theCritical Value Method The values of that will result in the rejection of the null hypothesis are called the critical region of the distribution When we use a predetermined significance level α, the Critical Value Method and the P-Value Method are logically equivalent.
Testing µ When σ is Known (Critical Region Method) State the null hypothesis, alternate hypothesis, and level of significance. If x is normally distributed, any sample size will suffice. If not, n ≥ 30 is required. Calculate:
Testing µ When σ is Known (Critical Region Method) Show the critical region and critical value(s) on a graph (determined by the alternate hypothesis and α). Conclude in favor of the alternate hypothesis if z is in the critical region. State a conclusion within the context of the problem.
9.3 Testing a Proportion p Test assumptions: r is a binomial variable n is the number of independent trials p is the probability of success on each trial np > 5 and n(1-p) > 5
Testing p State the null hypothesis, alternate hypothesis, and level of significance. Check np > 5 and nq > 5 (recall q = 1 – p). Compute: p = the specified value in H0
Testing p Use the standard normal table and the type of test (one or two-tailed) to determine the P-value. Make a statistical conclusion: If P-value ≤ α, reject H0. If P-value > α, do not reject H0. Make a context-specific conclusion.
Using the Critical Value Method for p As when testing for means, we can use the critical value method when testing for p. Use the critical value graphs exactly as when testing µ.
Critical Thinking: Issues Related to Hypothesis Testing Central question – Is the value of sample test statistics too far away from the value of the population parameter proposed in H0 to occur by chance alone? – P-value tells the probability for that to occur by chance alone.
Critical Thinking: Issues Related to Hypothesis Testing If the P-value is so close to α, then we might attempt to clarify the results by - Increasing the sample size - controlling the experiment to reduce the standard deviation. How reliable is the study and the measurements in the sample? – consider the source of the data and the reliability of the organization doing the study.