Basic Data Analysis
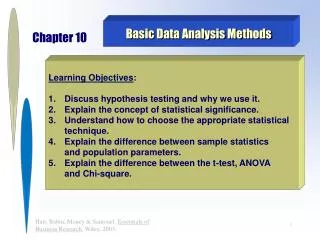
This guide explores basic data analysis techniques, including tabulation, frequency tables, and descriptive measures for nominal and ordinal data. You will learn about cross-tabulation methods for group comparison and significance testing using ANOVA and MANOVA. The significance standard is highlighted, including how to interpret p-values, and the implications of hypothesis testing. We examine the impact of independent variables on dependent variables through regression analysis, emphasizing the importance of statistical significance and the interpretation of results.


Basic Data Analysis
E N D
Presentation Transcript
Tabulation • Frequency table • Percentages
Type of Measurement Type of descriptive analysis Nominal Cross Tabs Mode
Type of Measurement Type of descriptive analysis Ordinal Rank order Median
Type of Measurement Type of descriptive analysis Interval Arithmetic mean
CROSS-TABULATION • Analyze data by groups or categories • Compare differences • Percentage cross-tabulations
Data Transformation • A.K.A data conversion • Changing the original form of the data to a new format • More appropriate data analysis • New variables • Summated • Standardized
Degrees of Significance • Mathematical differences • Statistically significant differences • Managerially significant differences
Testing the Hypotheses • The key question is whether we reject or fail to reject the hypothesis. • Depends on the results of the hypothesis test • If testing differences between groups, was the difference statistically significant • If testing impact of independent variable on dependent variable, was the impact statistically significant • How the hypothesis was worded
Differences Between Groups • Primary tests used are ANOVA and MANOVA • ANOVA = Analysis of Variance • MANOVA = Multiple Analysis of Variance • Significance Standard: • Churchill (1978) Alpha or Sig. less than or equal to 0.05 • If Sig. is less than or equal to 0.05, then a statistically significant difference exists between the groups.
Example • Hypothesis: No difference exists between females and males on technophobia. • If a statistically significant difference exists, we reject the hypothesis. • If no s.s. difference exists, we fail to reject.
Example • Hypothesis: Males are more technophobic then females (i.e., a difference does exist) • If a statistically significant difference exists, and it is in the direction predicted, we fail to reject the hypothesis. • If no s.s. difference exists, or if females are statistically more likely to be technophobic, we reject the hypothesis.
Testing for Significant Causality • Simple regression or Multiple regression • Same standard of significance (Churchill 1978) • Adj. R2 = percentage of the variance in the dependent variable explained by the regression model. • If Sig. is less than or equal to 0.05, then the independent variable IS having a statistically significant impact on the dependent variable. • Note: must take into account whether the impact is positive or negative.
Example • Hypothesis: Technophobia positively influences mental intangibility. • If a technophobia is shown to statistically impact mental intangibility (Sig. is less than or equal to 0.05), AND. • The impact is positive, we fail to reject the hypothesis. • Otherwise, we reject the hypothesis.