Marketing and Logistics
790 likes | 2.23k Vues
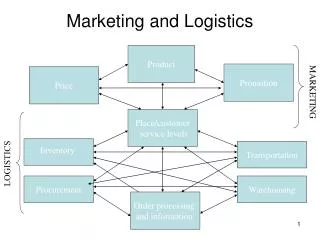
Product. Promotion. Price. MARKETING. Place/customer service levels. Inventory. Transportation. LOGISTICS. Procurement. Warehousing. Order processing and information. Marketing and Logistics. Logistics Operations. Handling. Packaging. Transportation. Demand. Production

Marketing and Logistics
E N D
Presentation Transcript
Product Promotion Price MARKETING Place/customer service levels Inventory Transportation LOGISTICS Procurement Warehousing Order processing and information Marketing and Logistics
Logistics Operations Handling Packaging Transportation Demand Production Scheduling Purchase Purchase Orders Processing Stock Management Sales Warehousing
Value-Added Functions of Logistics Production Logistics Control Location Time
Evolution of Logistical Integration, 1960-2000 Demand Forecasting 1980s Purchasing Materials Management Requirements Planning Production Planning 1990s Manufacturing Inventory 2000s Warehousing Logistics Supply Chain Management Materials Handling Packaging Inventory Distribution Planning Physical Distribution Information Technology Order Processing Marketing Transportation Strategic Planning Customer Service
The goal of supply chain management “To manage upstream and downstream relationships with suppliers and customers in order to create enhanced value in the final market place at less cost to the supply chain as a whole.”
Changes in Global Trade Flows After 1990 Before 1990 Developed Countries Developed Countries Developing Countries Developing Countries Flows of raw materials Flows of merchandises Industrial Pole
Levels of Economic Integration Political Union Common government Common currency, harmonized tax rates, common monetary and fiscal policy: EU (partial) Economic Union Level of integration Common Market Factors of production move freely between members Customs Union Common external tariffs Free Trade Free trade between members: NAFTA, Mercosur, ASEAN (partial) Complexity
International Trade and Transportation Chains International Trade A B Trade barrier Destination Origin Transport Chain Disassembly Assembly A B Maritime Road Rail Customs Transshipment
Complexity of the Supply Chain National Supply Chain Complex Multinational Supply Chain Simple National International Factory Representative High-throughput DC Distribution center
Product Life Cycle Competition Monopoly Competitors Innovating firm Sales Decline of production Idea Promotion First competitors Mass production Research and development Growth Decline Maturity Stage 1 Stage 2 Stage 3 Stage 4
Shorter life cycles make timing crucial Market Late Entrant Sales Obsolescent Stock Time • Less time to make profit • Higher risk of obsolescence
The role of cash in creating shareholder value “the value of a company is determined by the discounted value of the cash that can be taken out of the business during its remaining life” Warren Buffet
Logistics impact on operating income Income statement Net sales Costs of goods sold Selling and administration expense Interest expense Income before tax Logistics variable Customer service Purchasing strategy Capacity scheduling and control Order processing Transportation Warehousing Inventory control Packaging Support activities Inventory carrying cost
Logistics impact on the balance sheet Balance sheet Assets Cash Receivables Inventories Property, plant and equipment Liabilities Current liabilities Debt Equity Logistics variable Order cycle time Order completion rate Invoice accuracy Inventory Distribution facilities and equipment Plant and equipment Purchase order quantities Financing options for inventory Plant and equipment
Boost shareholder value Raise return on capital Routes to improved shareholder value Net income increase Capital reduction Revenue growth Cost optimisation Working capital Fixed assets Sourcing Production Logistics Network Facilities Real estate Inventory Receivables Payables Innovation Customer relationship management Integrated supply chain Source : Mercer Management Consulting
Material & Purchases Sales + Net operating profit Labour + Cost of sales Overheads Economic value added Cost of debt True cost of capital Inventory Cost of equity + x Capital charge Net receivables Net working capital Capital employed + + Cash Fixed assets Logistics and economic value added
Total Freight Costs for Imports in World Trade (% of Total Costs)
Market Share by Freight Transport Mode, Western Europe, 1980-2002 (in ton-km)
Logistics Costs and Economic Development Agriculture Mining Industry Services Information Argentina Poland Brazil Kenya Ukraine Belgium Canada Logistics Costs / GNP Japan United States Singapore Economic Development
Logistical Cost Trade-off cost total distribution costs inventory costs storage costs transport costs no. of warehouses
From Push to Pull Logistics Supplier Supplier Supplier Supplier Supplier Supplier Supplier Supplier Supplier Supplier Freight flow Manufacturer Manufacturer 3PL Distributor Distributor Customer Returns / Recycling Point-of-sale data Customer Push Pull
Average Order Lead Times of European Manufacturers, Wholesalers, and Retailers
Changes in the Relative Importance of Logistical Functions in Distribution Systems
Conventional and Contemporary Arrangement of Goods Flow Conventional Raw Materials & Parts Manufacturing Distribution Customers Local Distribution Raw Materials National Distribution Regional Storage Retailers Storage Contemporary Supply Chain Management Customers Raw Materials Distribution Center Manufacturing Retailers Material flow (delivery) Core component Information flow (order)
The Global Car Production Network Mazda Isuzu Suzuki Mercedes Benz Jaguar Land Rover Vauxhall Opel Dailmer Chrysler Ford GM Chrysler Jeep Volvo Aston Martin Daewoo Saab Bentley Skoda Lancia Maserati Toyota VAG Fiat Daihatsu BMW VW Seat Audi Ferrari Alfa Romeo Rolls Royce Citroen Porsche PSA Nissan Renault Honda Equity ownership Joint venture Equity relationship Functionally integrated group Peugeot Hyundai Mitsubishi
The Automobile Supply Chain Supplying industries Bodies Manufacture and stamping of body panels Body assembling and painting Steel and other metals Rubber Components Final Assembly Consumer market Manufacture of mechanical and electrical components (wheels, tires, seats, breaking systems, windshields, exhausts, etc.) Electronics Plastic Engines and transmissions Glass Forging and casting of engine and transmission components Machining and assembly of engines and transmissions Textiles
Cereals Supply Chain Manufacturing Extraction Farm Processing Facility Grain Cereal Distribution and Retailing Packaged Cereal Store Packaging Distributor Converter Paperboard Wood Pulp Packaged Cereal Label Mfg Wood Pulp Mfg Labels Wood Pulp
Forward and Reverse Distribution Producers Distributors Consumers Suppliers Recyclers Collectors Forward Channel Reverse Channel
Cross-Docking Distribution Center Before Cross-Docking Distribution Center Suppliers Suppliers LTL Customers Receiving Sorting After Cross-Docking Shipping TL Cross-Docking DC TL Customers
National Semiconductors, Supply Chain, 1993, 2001, 2005 Regional Distribution Centers (1993) South Portland (Maine) Bangkok (Thailand) Santa Clara Santa Clara (CA) Penang (Malaysia) South Portland Salt Lake City (UT) Customers Melaka (Malaysia) Swindon (UK) Arlington (TX) Toa Payoh (Singapore) Hong Kong Greenock (Scotland) Cebu (Philippines) Tokyo Migdal Haemek (Israel) Global Distribution Center (2001) Bangkok (Thailand) South Portland (Maine) Penang (Malaysia) Santa Clara (CA) Melaka (Malaysia) Singapore (GDC) Salt Lake City (UT) Toa Payoh (Singapore) Arlington (TX) Greenock (Scotland) Cebu (Philippines) Supply Chain Rationalization (2005) Melaka (Malaysia) South Portland (Maine) Singapore (GDC) Toa Payoh (Singapore) Arlington (TX) Greenock (Scotland) Suzhou (China) Assembly & Testing Wafer Fabrication Distribution Center
Gaining competitive advantage “A business is profitable if the value it creates exceeds the cost of performing the value activities. To gain competitive advantage over its rivals, a company must either perform these activities at a lower cost or perform them in a way that leads to differentiation and a premium price (more value).” Michael Porter
Materials Management Manufacturing Management Distribution Achieving an integrated supply chain Stage One: Baseline Material flow Customer service Material Control Sales Purchasing Production Distribution Stage Two: Functional Integration Material flow Customer service Materials Management Manufacturing Management Distribution Stage Three: Internal Integration Material flow Customer service Stage Four: External Integration Material flow Customer service Internal Supply Chain Suppliers Customers
The two dimensions of supply chain excellence • Cost advantage : Lower end-to-end delivered cost • Value advantage : Creating superior customer value through enhanced service
Supply chain excellence High Relative Customer Value Low High Low Relative Delivered Cost
Value Advantage • Logistics Leverage Opportunities: • Tailored service • Reliability • Responsiveness, etc • Cost Advantage • Logistics Leverage Opportunities: • Capacity utilisation • Asset turn • Schedule integration Gaining competitive advantage through logistics
How long is the logistics pipeline? Cumulative Lead-Time (Procurement to Payment) Raw Material Stock Sub-Assembly Stock Intermediate Stock Product Assembly Finished Stock at Central Warehouse In-Transit Regional Distribution Centre Stock Customer Order Cycle (Order-Cash)
Logistics and E-commerce Supply chain Supply chain Warehousing E-Retailer Retailer Warehousing E-Logistics Traditional Logistics Customers Customers