Download
1 / 70
730 likes | 1.31k Vues
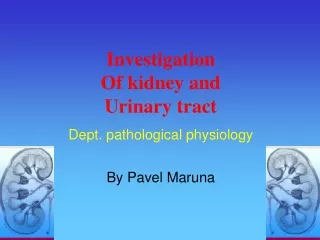
ECG EXAMINATION Seminary of pathophysiology Pavel Maruna. Electrical conduction in heart. SA node (= pacemaker). AV node. Bundle of His. Right and left bundle branches. Purkynje fibres. Cellular depolarization . What do we measure? What is positive and negative vector?.

E N D
ECG EXAMINATION Seminary of pathophysiology Pavel Maruna
Electrical conduction in heart SA node (= pacemaker) AV node Bundle of His Right and left bundle branches Purkynje fibres
Cellular depolarization • What do we measure? • What is positive and negative vector?
12-lead ECG examination Limb leads aVL aVR Bipolar leads I, II, III Pseudounipolar leads aVR, aVL, aVF aVF
12-lead ECG examination Chest leads Unipolar leads
QRS axis (Axis of QRS complex depolarization) - 30° to + 105°
initiation of impulse in the SA node atrial depolarization
initiation of impulse in the SA node atrial depolarization depolarization of AV nodus and bundle of His
septal depolarization early ventricular depolarization
septal depolarization early ventricular depolarization late ventricular depolarization
ventricular systole ventricular repolarization
ventricular systole ventricular repolarization repolarization of bundle of His
PR (PQ) interval (0,12 - 0,20 s) QTc interval (to 0,44 s) QRS complex (0,06 - 0,10 s)
What to see on the curve? • Rhythm? • P wave • Intervals • QRS complex • ST segment • T wave (U wave)
P wave Electrical impulse originates in the SA node Impulse triggers atrial depolarization • Physiology: • positive orientation (possible biphasic in I lead) • duration < 0,11 s, amplitude < 2,5 mm • Pathology: • hypertrophy of left or right atrium • abnormal conduction (SVES)
P wave P mitrale High P amplitude due to left atrial hypertrophy
PR (PQ) interval depolarization of AV node and bundle of His It represents the physiological delay in conduction from atrial depolarization to the beginning of ventricular depolarization. It is electrically neutral. Limits: 0,12 - 0,20 s Physiological importance: 1. synchronization of both atrial and ventric. systoles 2. protection against the transmission of supraventricular tachyarrhythmia to vetricular tachycardia
PR (PQ) interval AV blockade 1st = prolongation of PR interval 2nd = partial blockade (transmission of selected impulses) - Wenckenbach - Mobitz
PR (PQ) interval AV blockade 3rd = complete blockade
QRS complex Depolarization of the ventricles • Physiology: • duration 0,06 - 0,10 s • Q < 0,04 s, < 25 % of R wave • Sokolow index (S in V2 + R in V5) < 35 mm (< 45 mm for young) • axis of ventricular depolarization -30 to +105 °
QRS complex • Physiology: • duration 0,06 - 0,10 s • Q < 0,04 s, < 25 % of R wave • Sokolow index (SV2 + RV5) < 35 mm (< 45 mm for young) • axis of ventricular depolarization -30 to +105 ° • VAT (ventricular activation time) of LV < 0,04 s, RV < 0,03 s
QRS complex Both QRS complex duration and shape is depend on: 1. Physiology of His-Purkine´s system or aberrant signal passing VES
QRS complex Both QRS complex duration and shape is depend on: 1. Physiology of His-Purkine´s system or aberrant signal passing RBBB ...................... (QRS prolongation, rSR´ in V1, negative T wave) Intraventricular blockades V1
QRS complex Both QRS complex duration and shape depend on: 2. Myocardial mass LV hypertrophy RV hypertrophy cardiomyopathy
QRS complex wide QRS complex Both QRS complex duration and shape is depend on: 3. Factors affecting signal velocity - metabolic, endocrine, and pharmacological high sharp T wave hyperkalemia
QRS complex Both QRS complex duration and shape is depend on: 3. Factors affecting signal velocity - metabolic, endocrine, and pharmacological digitalis
QRS complex Prolongation Shortening LV, RV hypertrophy diffuse alteration (amyloid, fibrosis) hyperkalemia, digoxin artificial factors (obesity, pericard. effusion) intraventricular blockade VES
QRS complex Pathological Q wave Q wave prolongation (> 0,04 s) and depression (> 25 % R) Manifestation of transmural myocardial necrosis „Cavity potential“
ST segment The length between the end of the S wave (end of ventricular depolarization) and the beginning of repolarization • From „J point“ on the end of QRS complex, to inclination of T wave • Normally, all cells have the same potential = ST segment is electrically neutral (on isolectric line)
ST segment Physiological changes sympathicus ... ST depression, „anchor-like“ curve parasympathicus (vagus) ... ST elevation syndrome of an early repolarization Artificial changes depend on lead localization, chest malformation etc. Patological changes electric potential of destroyed myocardial area
ST segment Ischemic focus has a different electric potential = electric vector leads to this area 1. subendocardial ischemia (non-Q MI, AP paroxysm) ... ST depresssion
ST segment Ischemic focus has a different electric potential = electric vector leads to this area 2. subepicardial ischemia (Q-MI, spastic form of AP, aneurysma) ... elevation of ST segment
T wave Ventricular repolarization Normally: a repolarization directs from epicardium to endocardium = T wave is concordant with QRS complex Ischemic area: a repolarization is delayed, an action potential is extended Vector of repolarization is directed from ischemic area: - subendocardial ischemia ... to epicardium ... T wave elevation - subepicardial ischemia ... to endocardium ... T wave inversion
T wave • LV overload • neurocirculatory asthenia • sympathetic system • hypokalemie • hyperglycemia • myxoedema • pancreatitis • pneumotorax Nonspecific changes Diffuse T changes, T wave asymmetric or biphasic
T wave Ischemia Nonspecific changes Localized T changes T wave - symmetric negativity Diffuse T changes, T wave asymmetric or biphasic
Refractory period 1. Absolute = Absolutely no stimulation can cause another action potential 2. Relative = It is possible to cause another action potential, but the intensity of the premature contraction will be relative to the time in this period. „R on T“ phenomena „Malignant VES“: R wave of the next beat falls in certain portions of the previous T-wave ... Serious and life-threatening arrhythmia
Holter monitoring 24-h ECG recording Ambulatory ECG device Analysis of mean, maximal, and minimal HR, occurrence and frequency of major arrhythmia Confrontation of record and subjective difficulties (patient activity log) Indications: 1. syncope or palpitation of unclear origin 2. an unveiling of latent ischemia 3. an antiarrythmic therapy control 4. a pacemaker control
Holter monitoring Patient No. 1 Finding of atrial fibrillation. Pauses > 2 s Rare ventricular ES
Holter monitoring Patient No. 2 Ventricular fibrillation
Holter monitoring Patient No. 3 Ventricular tachycardia
Ergometry, exercise ECG Gradual load increase in 4-min. intervals, basic level 25 - 75 W Stopping - submaximal load or complications (accelerated hypertension, polytopic VES, blockades, ST elevation ST, ST depression > 2 mm, T inversion Coincidence of chest pain + ST changes = confirmation of ischemia Indications: 1. specification of ischem. disease prognosis 2. suspicion on ischemic disease 3. examination of functional capacity