Understanding Common Stock: Types, Ownership, and Dividend Basics
520 likes | 672 Vues
Common stock represents ownership in a corporation and comes with various classifications, rights, and claims. This guide covers key concepts like types of stock (common, preferred, Class A, Class B), the role of the Board of Directors, dividends, and important stock metrics such as the dividend payout ratio, capital gains, and different stock categories (growth, income, speculative). Understanding these fundamentals is crucial for investors aiming to navigate the stock market effectively and assess the value of their investments.

Understanding Common Stock: Types, Ownership, and Dividend Basics
E N D
Presentation Transcript
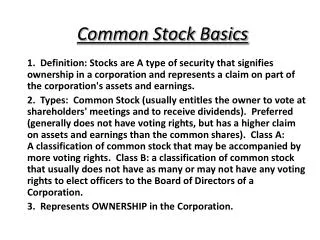
Common Stock Basics 1. Definition: Stocks are A type of security that signifies ownership in a corporation and represents a claim on part of the corporation's assets and earnings. 2. Types: Common Stock (usually entitles the owner to vote at shareholders' meetings and to receive dividends). Preferred (generally does not have voting rights, but has a higher claim on assets and earnings than the common shares). Class A: A classification of common stock that may be accompanied by more voting rights. Class B: a classification of common stock that usually does not have as many or may not have any voting rights to elect officers to the Board of Directors of a Corporation. 3. Represents OWNERSHIP in the Corporation.
Common Stock Basics 4. Owners are also referred to as shareholders or equity owners. 5. Street name: A brokerage account where the customer's securities and assets are held in the name of the brokerage firm, rather than you holding the stock certificate yourself. The customer is still listed as the real or beneficial owner. 6. Board of Directors: A group of individuals that are elected as, or elected to act as, representatives of the stockholders to establish corporate management related policies and to make decisions on major company issues. Such issues include the hiring/firing of executives, dividend policies, options policies and executive compensation. Every public company must have a Board of Directors.
Common Stock Basics 7. Dividends. Distribution of a portion of a company's earnings, decided by the board of directors, to a class of its shareholders. The dividend is most often quoted in terms of the dollar amount each share receives (i.e. dividends per share or DPS). It can also be quoted in terms of a percent of the current market price, referred to as dividend yield. Dividends may be in the form of cash, stock or property. Most secure and stable companies offer dividends to their stockholders. Their share prices might not move much, but the dividend attempts to make up for this.In the U.S., dividends face double taxation - the amount comes from after-tax income the company generated and the recipients pay taxes on them.As of 2003, cash dividends are taxed at a maximum rate of 15% as long as the stock has been held for at least 60 out of the 120 days beginning 60 days prior to the ex-dividend date. If you have held the stock for a period of less than this the dividend will be taxed at your regular income level.
Common Stock Basics 8. Dividend Payout Ratio: The percentage of earnings paid to shareholders in dividends. Calculated as: The payout ratio provides an idea of how well earnings support the dividend payments. More mature companies tend to have a higher payout ratio.
Common Stock Basics 9. Capital Gain: Profit that results when the price of a security held by a mutual fund rises above its purchase price and the security is sold (realized gain). If the security continues to be held, the gain is unrealized. A capital loss would occur when the opposite takes place. 10. Growth Stock: A stock that experiences a continued period of growth exceeding that of the economy. Generally, the duration is over a year in length. 11. Income Stock: A stock that has a high, consistent, dividend paid annually. 12. Speculative Stock: Stocks that offer the potential for substantial price appreciation, usually because of some special situation such as new management or the introduction of a promising new product.
Common Stock Basics 13. Cyclical Stocks: these are stocks whose earnings and overall market performance are closely linked to the general state of the economy. 14. Defensive Stocks: these stocks tend to hold their own, and even do well, when the economy starts to falter. 15. Mid-cap stocks: are medium-sized companies, generally with market values of less than $4-$5 billion but more than $1 billion. 16. Small-cap stocks: are stocks that generally have market values of less than $1 billion but can offer above-average returns.
Other Common Stock Values 17. Par Value: A dollar amount that is assigned to a security when representing the value contributed for each share in cash or goods. 18. Book Value: the value of the equity of the firm divided by the number of shares outstanding. 19. Liquidation Value: the value obtained for selling all the assets of the corporation on the auction block. 20. Market Value: the current market price of the stock times the number of shares outstanding. 21. Investment (Intrinsic) Value: the value of the corporation based on discounted cash flow analysis and the income generating capacity of the firm.
Stock Market Mentality • Common sense must be the foundation for investing in today’s market. • Yet the paradox is that this concept is uncommon among investors in today’s marketplace. • People often refer to a stock or the market as either “overvalued” or “undervalued” yet have no idea how to determine the INTRINSIC VALUE of a stock. • In simple terms a stock or more accurately all the stock of a company, is the SUM of all future cash flows the shares will generate in the future discounted to their PRESENT VALUE. • Estimating that amount of cash flow and its present value are at the heart of FUNDAMENTAL ANALYSIS. • Therefore, it is more accurate to refer to a stock or index as either OVERPRICED or UNDERPRICED. • Today, most institutional and many individual investors are caught up with the “market index” and • it’s value. For example there is an index on the • NASDAQ 100 – with a symbol of QQQ.
The Q Mentality • Most investors are obsessed with the INDEX of the Market and which way the Market is going, either up or down. • Investors track movement of the Market (the QQQ) and attempt to “guess” if it is undervalued or overvalued at any point in time – almost on a daily basis. • This results in a short-term myopic view of what is really going on in the market and how to ultimately analyze companies. • Rather than the INDEX approach to investing, we will take the BUSINESS ANALYSIS approach to investing. • The BUSINESS ANALYSIS approach is the anti-thesis of the Q mentality.
The Q Mentality • Most investors tend to speculate rather than invest. • Examples include buying shares in IPO’s or start-up businesses they know little or nothing about. • The difference between BUSINESS ANALYSIS and the Q market analysis is reinforced by Mr. Market which we will discuss shortly. • We will analyze stocks through our semester project, based on our circle of competence.
Valuation of Common Stock 1. Dividend Valuation Model A model for determining the intrinsic value of a stock, based on a future series of dividends that grow at a constant rate. Given a dividend per share that is payable in one year, and the assumption that the dividend grows at a constant rate in perpetuity, the model solves for the present value of the infinite series of future dividends. Where: D = Expected dividend per share one year from nowk = Required rate of return for equity investorG = Growth rate in dividends (in perpetuity)
Valuation of Common Stock 2. Capital Asset Pricing Model A model that describes the relationship between risk and expected return and that is used in the pricing of risky securities. The CAPM says that the expected return of a security or a portfolio equals the rate on a risk-free security plus a risk premium. If this expected return does not meet or beat the required return, then the investment should not be undertaken. The security market line plots the results of the CAPM for all different risks (betas).
Common Stock as an Inflation Hedge - Protection Against Inflation Over the last thirty years the S&P 500 has averaged approximately 12% annual compound return. - Inflation has averaged approximately 5.4% during the same time period.
Common Stock as an Inflation Hedge: S&P LT Bonds LT Gov’t Bonds T. Bills CPI Last 10: 13.8% 11.3% 11.9% 5.6% 3.5% Last 20: 14.6% 10.6% 10.4% 7.3% 5.2% Last 30: 10.7% 8.2% 7.9% 6.7% 5.4% Last 40: 10.8% 6.8% 6.4% 5.7% 4.5% Last 50: 11.9% 5.8% 5.3% 5.7% 4.4% Source: Ibbotson and Sinquefield, “Stocks, Bonds, Bills and Inflation 2010 yearbook,” Chicago.
Stock Market Basics Most stocks are traded on exchanges, which are places where buyers and sellers meet and decide on a price. Some exchanges are physical locations where transactions are carried out on a trading floor. The purpose of a stock market is to facilitate the exchange of securities between buyers and sellers, reducing the risks of investing.
Stock Market Basics Types of Markets The primary market is where securities are created (by means of an IPO) while, in the secondary market, investors trade previously-issued securities without the involvement of the issuing-companies. The secondary market is what people are referring to when they talk about the stock market. It is important to understand that the trading of a company's stock does not directly involve that company. The most prestigious exchange in the world is the New York Stock Exchange (NYSE). The "Big Board" was founded over 200 years ago in 1792 with the signing of the Buttonwood Agreement by 24 New York City stockbrokers and merchants. Currently the NYSE, with stocks like General Electric, McDonald's, Citigroup, Coca-Cola, Gillette and Wal-mart, is the market of choice for the largest companies in America.
Stock Market Basicsthe OTC and Nasdaq The second type of exchange is the virtual sort called an over-the-counter (OTC) market, of which the Nasdaq is the most popular. These markets have no central location or floor brokers whatsoever. Trading is done through a computer and telecommunications network of dealers. It used to be that the largest companies were listed only on the NYSE while all other second tier stocks traded on the other exchanges. The tech boom of the late '90s changed all this; now the Nasdaq is home to several big technology companies such as Microsoft, Cisco, Intel, Dell and Oracle.
Stock Market Basicsthe AMEX The third-largest stock exchange by trading volume in the United States. The AMEX is located in New York City and handles about 10% of all securities traded in the U.S. The AMEX has now merged with the Nasdaq. It was known as the "curb exchange" until 1921. It used to be a strong competitor to the New York Stock Exchange, but that role has since been filled by the Nasdaq. Today, almost all trading on the AMEX is in small-cap stocks, exchange-traded funds and derivatives.
Stock Market BasicsReading Stock Quotes Columns 1 & 2: 52-Week High and Low - These are the highest and lowest prices at which a stock has traded over the previous 52 weeks (one year). This typically does not include the previous day's trading. Column 3: Company Name & Type of Stock - This column lists the name of the company. If there are no special symbols or letters following the name, it is common stock. Different symbols imply different classes of shares. For example, "pf" means the shares are preferred stock. Column 4: Ticker Symbol - This is the unique alphabetic name which identifies the stock. If you watch financial TV, you have seen the ticker tape move across the screen, quoting the latest prices alongside this symbol. If you are looking for stock quotes online, you always search for a company by the ticker symbol. If you don't know what a particular company's ticker is you can search for it at: http://finance.yahoo.com/.
Stock Market BasicsReading Stock Quotes Column 5: Dividend Per Share - This indicates the annual dividend payment per share. If this space is blank, the company does not currently pay out dividends. Column 6: Dividend Yield - The percentage return on the dividend. Calculated as annual dividends per share divided by price per share. Column 7: Price/Earnings Ratio - This is calculated by dividing the current stock price by earnings per share from the last four quarters. For more detail on how to interpret this, see our P/E Ratio tutorial. Column 8: Trading Volume - This figure shows the total number of shares traded for the day, listed in hundreds. To get the actual number traded, add "00" to the end of the number listed. Column 9 & 10: Day High and Low - This indicates the price range at which the stock has traded at throughout the day. In other words, these are the maximum and the minimum prices that people have paid for the stock.
Stock Market BasicsReading Stock Quotes Column 12: Net Change - This is the dollar value change in the stock price from the previous day's closing price. When you hear about a stock being "up for the day," it means the net change was positive. Quotes on the InternetNowadays, it's far more convenient for most to get stock quotes off the Internet. This method is superior because most sites update throughout the day and give you more information, news, charting, research, etc.
Stock Market Basics Animals in the Market The use of "bull" and "bear" to describe markets comes from the way in which each animal attacks its opponents. That is, a bull thrusts its horns up into the air, and a bear swipes its paws down. These actions are metaphors for the movement of a market: if the trend is up, it is considered a bull market. And if the trend is down, it is considered a bear market. The Bull market is when everything in the economy is great, people are finding jobs, gross domestic product (GDP) is growing, and stocks are rising. Things are just plain rosy! Picking stocks during a bull market is easier because everything is going up. Bull markets cannot last forever though, and sometimes they can lead to dangerous situations if stocks become overvalued. If a person is optimistic and believes that stocks will go up, he or she is called a "bull" and is said to have a "bullish outlook".
Stock Market BasicsBear Markets Bear Markets characterize the attitude of investors who believes that a particular security or market is headed downward. Bears attempt to profit from a decline in prices. Bears are generally pessimistic about the state of a given market. Bearish sentiment can be applied to all types of markets including commodity markets, stock markets and the bond market.
Stock Market BasicsSelling Short The selling of a security that the seller does not own, or any sale that is completed by the delivery of a security borrowed by the seller. Short sellers assume that they will be able to buy the stock at a lower amount than the price at which they sold short. Selling short is the opposite of going long. That is, short sellers make money if the stock goes down in price. This is an advanced trading strategy with many unique risks and pitfalls. Novice investors are advised to avoid short sales.
A. Basic Characteristics • 1. Equity Capital • 2. Types • a. Growth Stock • b. Income Stock • c. Speculative Stock • d. Cyclical Stock • e. Defensive Stock
Common Stock as an Inflation Hedge • Protection Against Inflation • Over the last thirty years the S&P 500 has averaged approximately 11% annual compound return. • Inflation has averaged approximately 5.4% during the same time period.
Types of Security Analysis • 1. Fundamental Analysis • 2. Technical Analysis
The Father of Fundamental Analysis: Benjamin Graham • Who was Benjamin Graham? Fundamental Analysis:A method of evaluating a securityfactors. Fundamental analysts attempt to study everything that can affect the security's value, including macroeconomic factors (like the overall economy and industry conditions) and individually specific factors (like the financial condition and management of companies). Sources: Security Analysis (Graham and Dodd); The Intelligent Investor (Graham)
Ben Graham and Mr. Market: Long ago Ben Graham described the mental attitude toward market fluctuations that I believe to be most conducive to investment success. He said that you should imagine market quotations coming from a remarkably accommodating fellow named Mr. Market who is your partner in a private business. Without fail, Mr. Market appears daily and names a price at which he will either buy your interest or sell you his. Even though the business that the two of you own may have economic characteristics that are stable, Mr. Market’s quotations will be anything but stable. For, it is sad to say, Mr. Market is a fellow who has incurable emotional problems. At times he falls euphoric and can see only the favorable factors effecting the business. When in that mood, he names a very high buy-sell price because he fears that you will snap up his interest and rob him of imminent gains. At other times he is depressed and can see nothing but trouble ahead for both the business and the world. On these occasions he will name a very low price, since he is terrified that you will unload your interest on him.
Ben Graham and Mr. Market Continued: Mr. Market has another endearing characteristic: He doesn’t mind being ignored. If his quotation is uninteresting to you today, he will be back with a new one tomorrow. Transactions are strictly at your option. Under these conditions, the more manic-depressive his behavior, the better for you. But, like Cinderella at the ball, you must heed one warning or everything will turn into pumpkins and mice: Mr. Market is there to serve you, not to guide you. It is his pocketbook, not his wisdom, that you will find useful. If he shows up someday in a particularly foolish mood, you are free to either ignore him or to take advantage of him, but it will be disastrous if you fall under his influence. Indeed, if you aren’t certain that you understand and can value your business far better than Mr. Market, you don’t belong in the game. As they say in poker, “If you’ve been in the game 30 minutes and you don’t know who the patsy is, you’rethe patsy.”
Graham’s Fundamental Investment Rules • 1. Adequate Size • 2. Sufficient Strong Financial Condition • 3. Earnings Stability • 4. Dividend Record • 5. Earnings Growth • 6. Moderate Price/Earnings Ratio • 7. Moderate Ratio of Price to Assets
Terms 1. Net Current Assets (NCA) • Defined as: Current Assets - Current Liabilities - Long-Term Debt - Preferred Stock NCA Total NCAc = NCA/# of Common Shares
Terms (continued) 2. Data Source • S&P Stock Guide • Value Line, etc. 3. Earnings Per Share (EPS) 4. Market Price 5. Book Value Per Share 6. Dividends Per Share 7. Current Ratio
Terms (continued) • 8. Total Debt • 9. Equity • 10. Growth g = [ (1 + RP,-1)(1 + RP,-2) ... (1 + RP,-10)] - 1 1/n
Graham Company Value • Formula: E x (2g + 8.5) x 4.4/Y • - Where E is the current annual earnings per share • “g” is the annual earnings growth rate of 5% • conservatively. For Starbucks it is 15.8% • 8.5 is the base P/E ratio for a stock with no growth • Y is the current interest rate for AAA rated corporate • securities. • Example: Using the Starbucks V/L Data • E = $1.52; g = 5%; Y = 4% • Therefore: • $1.52 x [(2 x 15.8) + 8.5)] x (4.4/4) • $1.52 x (40.1) x 1.1 = $67.05 • Since Starbucks is selling at $41.68, this would • be a BUY decision.
The Graham Model • 1. Group A CriteriaMeasures: #1: E/P > 2 (AAA Yield)(1 pt.): RISK E/P > 1.33 (AAA Yield) (1/2 pt.): RISK #2: P/E < .4 (Avg. P/E in last 3 yrs.) (1 pt.): RISK P/E < .4 (Avg. P/E in last 10 yrs.) (1/2 pt.): RISK #3: P/Bk< 2/3 (1 pt.): FINANCIAL STRENGTH P/Bk< 1 (1/2 pt.): FINANCIAL STRENGTH #4: D/P > .67 (AAA Yield) (1 pt.): RISK D/P > .50 (AAA Yield) (1/2 pt.): RISK #5: P/NCAC< 1 (1 pt.): FINANCIAL STRENGTH P/NCAC< 1.33 (1/2 pt.): FINANCIAL STRENGTH
The Graham Model 2. Group B CriteriaMeasures: #6: CR > 2 (1 pt.): FINANCIAL STRENGTH CR > 1.8 (1/2 pt.): FINANCIAL STRENGTH #7: TD/E < 1.0 (1 pt.): FINANCIAL STRENGTH TD/E < 1.2 (1/2 pt.): FINANCIAL STRENGTH #8: TD/NCA < 2 (1 pt.): FINANCIAL STRENGTH NCA > 0 (1/2 pt.): FINANCIAL STRENGTH #9: G10> 7%/YR. (1 pt.): EARNINGS STABILITY G5> 7%/YR. (1/2 pt.): EARNINGS STABILITY #10: No more than 2 declines in earnings of 5% each over the last 10 years for one full point. EARNINGS STABILITY No more than 3 declines in earnings of 5% or more in last 10 years for one-half point. EARNINGS STABILITY
Graham’s 14 Investment Points Be an investor, not a speculator. Know the asking price. Search the market for bargains. Determine if the stock is undervalued. Regard corporate figures with suspicion. Don’t stress out. Don’t sweat the math.
Graham’s 14 Investment Points 8. Diversify among stocks and bonds. 9. Diversify among stocks. 10. When in doubt, stick to quality. 11. Use dividends as a clue for success. 12. Defend your shareholder rights. 13. Be patient. 14. Think for yourself.
The Influence of Philip Fisher The characteristics of a business that most impressed Fisher was: a company’s ability to grow sales and profits over the years at rates greater than the industry average. In order to do so, a company needed to possess “products or services with sufficient market potential to make it possible for a sizable increase in sales for at least several years.” Fisher was not so much concerned with the consistent annual increase in sales in any given year, rather, he judged a company’s success over a period of several years. He was aware that changes in the business cycle could and would have a material effect on sales and earnings in any given year.
The Influence of Philip Fisher Fisher identified companies that, decade by decade, showed promise of above-average growth. The two types of companies that could expect to achieve above-average growth were companies that, were: (1) “fortunate and able” and were (2) “fortunate because they are able.” Fisher also found that a company’s research and development efforts contribute mightily to the sustainability of the company’s above-average growth in sales. Even non-technical businesses need a dedicated research effort to produce better products and more efficient services.
The Influence of Philip Fisher Sales Organization: Fisher also examined a company’s sales organization. According to him, a company could develop outstanding products and services, but unless they were “expertly merchandised,” the research and development effort would never translate into revenues. Profits and Costs: Fisher also examined a company’s profit margins, its dedication to maintaining and improving profit margins, and, finally, its cost analysis and accounting controls. Fisher sought companies that were not only the lowest-cost producer of products or services but were dedicated to remaining that way.
Contemporary Fundamentals: • Peter Lynch’s Ten Golden Rules of Investing: 1. Don’t be intimidated by experts (ex spurts). 2. Look in your own backyard. 3. Don’t buy something you can’t illustrate with a crayon. 4. Make sure you have the stomach for stocks. 5. Avoid hot stocks in hot industries. 6. Owning stocks is like having children. Do not have more than you can handle. 7. Don’t even try to predict the future. 8. Avoid weekend worrying. Do not get scared out of good stocks. Own your mind. 9. Never invest in a company without first understanding its finances. 10. Do not expect too much, too soon. Think long-term.
Contemporary Fundamentals: • Peter Lynch’s mistakes to avoid: 1. Thinking that this year will be any different than any other year 2. Becoming too concerned over whether the stock market is going up or down 3. Trying to time the market 4. Not knowing the story behind the company in which you are buying stock 5. Buying stocks for the short-term
Contemporary Fundamentals: • Lynch Maxim’s: 1. A good company usually increases its dividends every year. 2. You can lose money in a very short time, but it takes a long time to make money. 3. The stock market isn’t a gamble as long as you pick good companies that you think will do well and not just because of the stock price. 4. You have to research the company before you put money into it. Source: One Up On Wallstreet, by Peter Lynch
Lynch Maxim’s (cont.) 5. When you invest in the stock market you should always diversify. 6. You should invest in several stocks (5). 7. Never fall in love with a stock, always have an open mind. 8. Do your homework. 9. Just because a stock goes down doesn’t mean it can’t go lower. 10. Over the long-term it is generally better to buy stocks in small companies. • Never buy a stock because it is cheap, but because you know a lot about it. Source: One Up On Wallstreet, by Peter Lynch
Sir John Marks Templeton • Who is Sir John Marks Templeton? John Templeton borrowed $10,000 and started a brilliant investment career, which enabled him to be one of two investors to become billionaires solely through their investment prowess. Templeton has had decade after decade of 20% plus annual returns and managed over $6 Billion in assets. Templeton is generally regarded as one of the world’s wisest and most successful investors. Forbes Magazine said, “Templeton is one of a handful of true investment greats in a field of crowded mediocrity and bloated reputations.” Templeton holds that the common denominator connecting successful people with successful enterprises is a devotion to ethical and spiritual principles. Many regard Sir John as the greatest Wallstreet Investor of all time.
Sir John Mark Templeton • Sir John’s 16 Rules for Investment Success: 1. Invest for maximum total real return including taxes and inflation. 2. Invest. Don’t trade or speculate. 3. Remain flexible and open-minded about types of investments. No one kind of investment is always best. 4. Buy at a low price. Buy what others are despondently selling. Then sell what others are despondently buying. 5. Search for bargains among quality stocks. 6. Buy value not market trends or economic value. 7. Diversify. There is safety in numbers. 8. Do your homework. Do not take the word of experts. Investigate before you invest.