Download
1 / 29
320 likes | 860 Vues
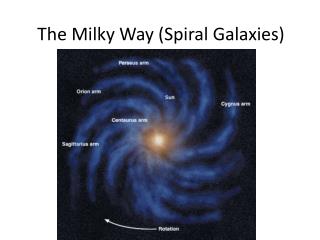
The differential Tully-Fisher relation for spiral galaxies. Irina Yegorova SISSA, Trieste, Italy. Outline:. Observations of spiral galaxies The standard Tully-Fisher relation Differential Tully-Fisher relation. Evidence of dark matter comes from:. WMAP. X-Ray. gravitational lensing.

E N D
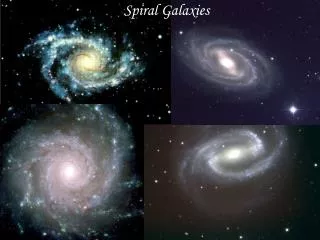
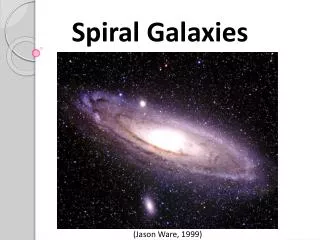
The differential Tully-Fisher relation for spiral galaxies Irina Yegorova SISSA, Trieste, Italy
Outline: • Observations of spiral galaxies • The standard Tully-Fisher relation • Differential Tully-Fisher relation
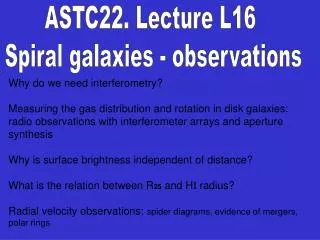
Evidence of dark matter comes from: WMAP X-Ray gravitational lensing rotation curves
blue shift red shift
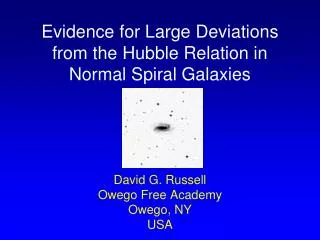
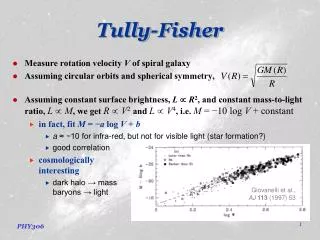
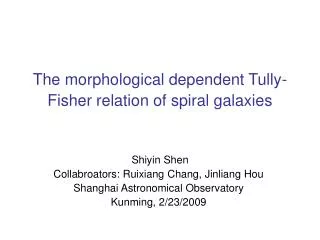
The Tully-Fisher(TF) relation is an empirically established correlation between the luminosity L of a spiral galaxy and its rotational velocity V (Tully-Fisher, 1977)
New method of determining Distances to galaxies R.B.Tully and J.R.Fisher, A&A, 54. 661-673, 1977
TF-relation has two important applications: 1. It is used to obtain cosmological distances M=m - 5logD - 25 2. It can be used for studying the dynamical properties and the evolution of galaxies
Physical basis of the TF-relation From the equation of centrifugal equilibrium we get: • V0 – representative velocity, M - total mass, • Rc – characteristic radius of luminous matter • - structural parameter depending on the shape of the mass distribution
The first equation can be written in this form: This equation can be written in the form of the Tully-Fisher relation:
Differential Tully-Fisher relation
Samples: 1st sample: 967 spiral galaxies Mathewson (1992) 2nd sample: 304 spiral galaxies Courteau (1997) 86 galaxies selected for analysis 3 sample: 329 spiral galaxies Vogt (2004) 81 galaxies selected for analysis
1. Mathewson sample: R R/Ropt; bin=0.2 2. Courteau sample: R R/Rd; bin=0.2 3. Vogt sample: R R/Rd; bin=0.2 Ropt=3.2Rd, where R_d is the disk exponential length-scale, for Freeman (exponential) disk this corresponds to the 25 B-mag/arcsec^2 photometric radius.
Slope of the TF-relation MB = ai + bilog V(Ri)
Gap in the slopes of 2 samples: No dark matter k=0.1 for I band k=0.3 for R band function of the band The slope of TF-relation is related to k
Physical meaning of the slope The slope of the TF-relation steadily rises with distance due to the fact that the fractional amount of the dark matter in galaxies changes with the radius. increases with R decreases with L this has influence on the slope
TF-relation using Vmax slope=-7,579; scatter=0,328; number of galaxies=843 slope=-5.54; scatter=0.49; number of galaxies=83
Main results: • We found the new method Differential TF relation. • 2. The slope decreases monotonically with the distance, while • the scatter increases with distance. This implies the presence • of a non luminous mass component (DM) whose dynamical • importance, with respect to the stellar disk (baryonic matter) • increases with radius. • 3. We found small scatter in the TF-relation. This implies • that galaxies have similar physical characteristics. • 4. Minimum of the scatter 0.15 (1st sample), 0.24 (2nd sample), • 0.29 (3 sample) at 2.2R/Rd at the position of the maximum disk contribution • We are planning to do mass modeling for these galaxies to • reproduce the observable slope and scatter in the TF-relation