Download
1 / 15
150 likes | 278 Vues
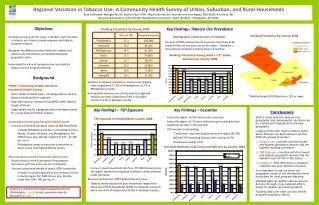
Prevalence of Tobacco Use. Prevalence of Tobacco Use. Current user: A person who has smoked once in the last 30 days Prevalence of tobacco use: The proportion of current users in a population Prevalence rates measure:

E N D
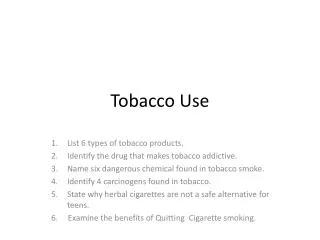
Prevalence of Tobacco Use Current user: A person who has smoked once in the last 30 days Prevalence of tobacco use: The proportion of current users in a population Prevalence rates measure: The use of cigarettes, cigars, pipes, and any other smoked tobacco products
Prevalence of Tobacco Use Estimated deaths attributable to tobacco worldwide . . . 1965: 1 million 2000: 4.9 million By 2020: >9 million Source: World Health Organization & American Cancer Society, Tobacco Control Country Profiles 2003
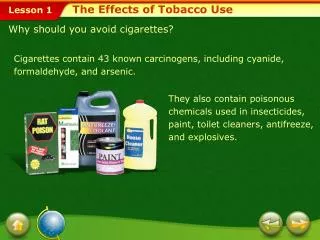
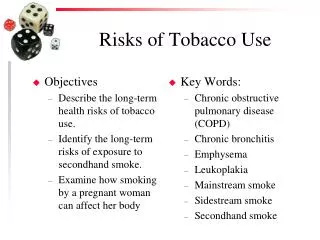
Prevalence of Tobacco Use US Centers for Disease Control and Prevention Cigarette smoking is the single most preventable cause of premature death in the United States.
Trends in SmokingAmong Adults Aged ≥25 Years, by Level of Education United States, 1970-2006 Source: Robert Wood Johnson ImpactTeen Tobacco Chart Book
Prevalence in Smoking, 2009 US rates 2009 Men: 21.3% Women: 18.4% Total: 19.8% State with highest prevalence: Kentucky Men: 28.8% Women: 27.8% States with the lowest prevalence: Men: Connecticut16.6% Women: Utah8% Source: CDC : BRFSS, MMWR 2009;58:221-226
Trends in Smoking Among Adults Aged ≥18 Years, by Race or Ethnicity, 1978-2007 Source: Robert Wood Johnson ImpactTeen Tobacco Chart Book, 2009
Prevalence in Cigarette Smoking Current Smoking – by Age, 2009 Percent Source: CDC, Office on Smoking and Health, 2008
Trends in Cigarette SmokingCurrent Smoking- Adults by Poverty Status 1983-2007 Source: Robert Wood Johnson ImpactTeen Tobacco Chart Book
Trends in Smoking High School Students and Adults Source: CDC, Office on Smoking and Health
Prevalence of Tobacco Use Current Smoking: Youth Data, 2008 3 million kids under 18 are current smokers 22% of high school students 6% of middle school students 3,500 kids try a cigarette each day 1,000 kids become regular smokers each day Source: Campaign for Tobacco Free Kids – Tobacco Use Among Youth, Smoking and Kids
Prevalence of Tobacco Use Where do I find prevalence data specific to my state? • CDC State Highlights • National Youth Tobacco Survey (NYTS) • Global Adult Tobacco Survey (GATS) • State Tobacco Activities Tracking and Evaluation (STATE) System • Behavioral Risk Factor Surveillance System (BRFSS)
Prevalence of Tobacco Use 2007 Smoking Prevalence Rates Percent Source:Centers for Disease Control and Prevention, Behavioral Risk Factor Surveillance System, 2007
Your State’s Prevalence Presenters Please change title and add data for the state where you’re conducting the training. Thank you.