Download

1 / 5
50 likes | 72 Vues
This research presents supplemental figures of Passing-Bablok regression graphs for each 25(OH)D assay compared with ID-XLC-MS/MS in different clinical subject groups. The figures show the correlation coefficients (R) between the assays. To convert 25(OH)D concentrations to ng/mL, multiply by 0.4.

E N D
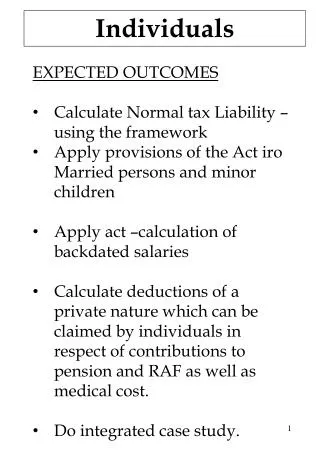
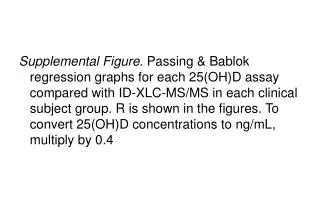
Supplemental Figure. Passing & Bablok regression graphs for each 25(OH)D assay compared with ID-XLC-MS/MS in each clinical subject group. R is shown in the figures. To convert 25(OH)D concentrations to ng/mL, multiply by 0.4
Healthy individuals R = 0.93 R = 0.94 R = 0.97 R = 0.92 R = 0.97 R = 0.94
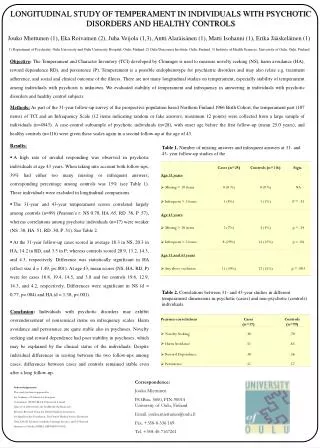
Pregnant women R = 0.92 R = 0.88 R = 0.91 R = 0.92 R = 0.92 R = 0.96
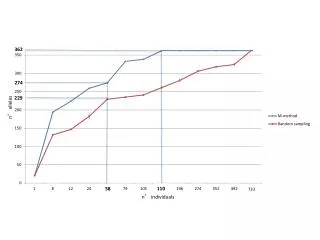
Hemodialysis patients R = 0.93 R = 0.86 R = 0.92 R = 0.93 R = 0.97 R = 0.84
Intensive care patients R = 0.81 R = 0.83 R = 0.94 Intensive care patients not determined with iSYS R = 0.91 R = 0.82