Download
1 / 11
120 likes | 275 Vues
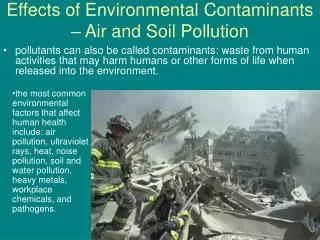
Subjects (from PNAMP). High Level Indicators (from NOAA). High Level Indicators (from NOAA). Amphibians Birds Contaminants/Toxics/Pollutants Environmental Condition Fish Hydrology/Water Quantity. Light Macroinvertebrates Mammals Multi-Species Other, Climate/Weather

E N D
Subjects (from PNAMP) High Level Indicators (from NOAA) High Level Indicators (from NOAA) • Amphibians • Birds • Contaminants/Toxics/Pollutants • Environmental Condition • Fish • Hydrology/Water Quantity • Light • Macroinvertebrates • Mammals • Multi-Species • Other, Climate/Weather • Pathogens/Disease • Plankton • Reptiles • Sediment/Substrate/Soils • Vegetation/Plants • Water Quality Habitat Hydropower Harvest Disease Predation Hatchery Natural Abundance Productivity Diversity Distribution Spatial Scale(s) of Inference Temporal Scale(s) of Inference Biological Status & Trend Threats Status and Trend Indicators Indicators Indicators Indicators Indicators Indicators Indicators Indicators Indicators Indicators Indicators
Subject(s) High Level Indicators High Level Indicators • Amphibians • Birds • Contaminants/Toxics/Pollutants • Environmental Condition • Fish • Hydrology/Water Quantity • Light • Macroinvertebrates • Mammals • Multi-Species • Other, Climate/Weather • Pathogens/Disease • Plankton • Reptiles • Sediment/Substrate/Soils • Vegetation/Plants • Water Quality Habitat Hydropower Harvest Disease Predation Hatchery Natural Abundance Productivity Diversity Distribution Coho Spatial Scale(s) of Inference – Oregon Lower Columbia ESU Temporal Scale(s) of Inference – Annual (status); 12 yr (trend) Biological Status & Trend Threats Status and Trend Indicators Indicators Indicators Indicators Indicators Indicators Indicators Indicators Indicators Indicators Indicators Non-migrant juveniles Migrant juveniles Spawners Recruits
High Level Indicators Abundance Productivity Diversity Distribution STRIDE Spatial Design Temporal Design Response Design Inference Design Indicators Indicators Indicators Indicators Non-migrant juveniles Migrant juveniles Spawners Recruits GRTS Non-stratified 4 panel rotating Metric Status Trend Spatial Scale Temporal Scale Measurement Spatial Scale Temporal Scale
High Level Indicators Abundance Productivity Diversity Distribution STRIDE Spatial Design Temporal Design Response Design Inference Design Indicators Indicators Indicators Indicators Non-migrant juveniles Migrant juveniles Spawners Recruits Specify Needed Degree of Certainty! GRTS Non-stratified 4 panel rotating Metric Status Trend Spatial Scale Temporal Scale Measurement Spatial Scale Temporal Scale
High Level Indicators Abundance Productivity Diversity Distribution STRIDE Spatial Design Temporal Design Response Design Inference Design Indicators Indicators Indicators Indicators Develop Goals and Objectives Non-migrant juveniles Migrant juveniles Spawners Recruits GRTS Non-stratified 4 panel rotating Metric Status Trend Spatial Scale Temporal Scale Measurement Spatial Scale Temporal Scale
High Level Indicators Abundance Productivity Diversity Distribution STRIDE Spatial Design Temporal Design Response Design Inference Design Indicators Indicators Indicators Indicators Develop Goals and Objectives Non-migrant juveniles Migrant juveniles Spawners Recruits Feedback to Goals and Objectives GRTS Non-stratified 4 panel rotating Metric Status Trend Spatial Scale Temporal Scale Measurement Spatial Scale Temporal Scale
High Level Indicators Abundance Productivity Diversity Distribution STRIDE Spatial Design Temporal Design Response Design Inference Design Indicators Indicators Indicators Indicators Non-migrant juveniles Migrant juveniles Spawners Recruits Protocols A Protocol is a plan, including a set of data collection and analysis Methods, to carry out a scientific study. Monitoring protocols, as described by Oakley et al. (2006), are detailed study plans that explain how data are to be collected, managed, analyzed, and reported, and are a key component of quality assurance for natural resource monitoring programs. Protocols must belong to one and only one Program. GRTS Non-stratified 4 panel rotating Metric Status Trend Spatial Scale Temporal Scale Measurement Spatial Scale Temporal Scale
High Level Indicators Abundance Productivity Diversity Distribution STRIDE Spatial Design Temporal Design Response Design Inference Design Indicators Indicators Indicators Indicators Non-migrant juveniles Migrant juveniles Spawners Recruits GRTS Non-stratified 4 panel rotating Status Trend Metric Measurement Methods A Method is a systematic, standard operating procedure for collecting or analyzing data for one or more Metrics or Indicators. Methods may be organized into Protocols; the same Method may be included in multiple Protocols. Methods must be: 1) described in documentation, 2) repeatable by others. Spatial Scale Temporal Scale Spatial Scale Temporal Scale
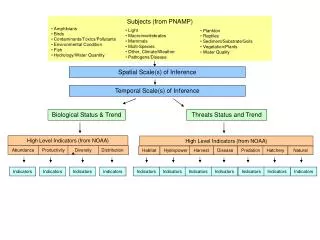
Subjects (from PNAMP) • Amphibians • Birds • Contaminants/Toxics/Pollutants • Environmental Condition • Fish • Hydrology/Water Quantity • Light • Macroinvertebrates • Mammals • Multi-Species • Other, Climate/Weather • Pathogens/Disease • Plankton • Reptiles • Sediment/Substrate/Soils • Vegetation/Plants • Water Quality Spatial Scale(s) of Inference Temporal Scale(s) of Inference Biological Status & Trend Threats Status and Trend
Subjects (from PNAMP) • Amphibians • Birds • Contaminants/Toxics/Pollutants • Environmental Condition • Fish • Hydrology/Water Quantity • Light • Macroinvertebrates • Mammals • Multi-Species • Other, Climate/Weather • Pathogens/Disease • Plankton • Reptiles • Sediment/Substrate/Soils • Vegetation/Plants • Water Quality Research and Evaluation Need Compliance & Implementation Action Effectiveness Mechanisms D Spatial Scale(s) of Inference Temporal Scale(s) of Inference Biological Status & Trend Threats Status and Trend Critical Uncertainties
Research and Evaluation Need Compliance & Implementation Action Effectiveness Mechanisms D Critical Uncertainties High Level Indicators Indicators Design Category Space for Time Baseline Staircase MBACIPS BACIPS BACI BA