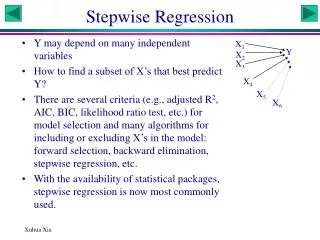
Stepwise Regression
Stepwise Regression. SAS. Download the Data. http://core.ecu.edu/psyc/wuenschk/StatData/StatData.htm. 3.2 625 540 65 2.7 4.1 575 680 75 4.5 3.0 520 480 65 2.5 2.6 545 520 55 3.1 3.7 520 490 75 3.6 4.0 655 535 65 4.3 4.3 630 720 75 4.6 2.7 500 500 75 3.0 and so on.

Stepwise Regression
E N D
Presentation Transcript
Download the Data • http://core.ecu.edu/psyc/wuenschk/StatData/StatData.htm 3.2 625 540 65 2.7 4.1 575 680 75 4.5 3.0 520 480 65 2.5 2.6 545 520 55 3.1 3.7 520 490 75 3.6 4.0 655 535 65 4.3 4.3 630 720 75 4.6 2.7 500 500 75 3.0 and so on
Download the SAS Code • http://core.ecu.edu/psyc/wuenschk/SAS/SAS-Programs.htm data grades; infile 'C:\Users\Vati\Documents\StatData\MultReg.dat'; input GPA GRE_Q GRE_V MAT AR; PROCREG; a: MODEL GPA = GRE_Q GRE_V MAT AR / STB SCORR2 selection=forwardslentry = .05 details; run;
Forward Selection, Step 1 All predictors have p < the slentry value of .05.AR has the lowest p. AR enters first.
Step 2 All predictors have p < the slentry value of .05.GRE-V has the lowest p. GRE-V enters second.
Step 3 No predictor has p < .05, forward selection terminates.
The Final Model R2 = .516, F(2, 27) = 14.36, p < .001
Backward Selection b: MODEL GPA = GRE_Q GRE_V MAT AR / STB SCORR2 selection=backwardslstay = .05 details; run; • We start out with a simultaneous multiple regression, including all predictors. • Then we trim that model.
Step 1 GRE-V and AR have p values that exceed the slstay value of .05. AR has the larger p, it is dropped from the model.
Step 2 Only GRE_V has p > .05, it is dropped from the model.
Step 3 No predictor has p < .05, backwards elimination halts.
The Final Model R2 = .5183, F(2, 27) = 18.87, p < .001
What the F Test? • Forward selection led to a model with AR and GRE_V • Backward selection led to a model with MAT and GRE_Q. • I am getting suspicious about the utility of procedures like this.
Fully Stepwise Selection c: MODEL GPA = GRE_Q GRE_V MAT AR / STB SCORR2 selection=stepwiseslentry=.08slstay = .08 details; run; • Like forward selection, but, once added to the model, a predictor is considered for elimination in subsequent steps.
Step 3 • Steps 1 and 2 are identical to those of forward selection, but with slentry set to .08, MAT enters the model.
Step 4 • GRE_Q enters. Now we have every predictor in the model
Step 5 • Once GRE_Q is in the model, AR and GRE_V become eligible for removal.
Step 6 • AR out, GRE_V still eligible for removal.
Step 7 • At this point, no variables in the model are eligible for removal • And no variables not in the model are eligible for entry. • The final model includes MAT and GRE_Q • Same as the final model with backwards selection.
R-Square Selection • d: MODEL GPA = GRE_Q GRE_V MAT AR / selection=rsquarecpmse; run; • Test all one predictor models, all two predictor models, and so on. • Goal is the get highest R2 with fewer than all predictor.
One Predictor Models • AR yields the highest R2 • C(p) = 16.74, MSE = .229 • Mallow says best model will be that with small C(p)and value of C(p)near that of p (number of parameters in the model). • p here is 2 – one predictor and the intercept • Howell suggests one keep adding predictors until MSE starts increasing.
Two Predictor Models • Compared to the best one predictor model, that with MAT and GRE_Q has • Considerably higher R2 • Considerably lower C(p) • Value of C(p), 5, close to value of p, 3. • Considerably lower MSE
Three Predictor Models • Adding GRE_V to the best two predictor model (GRE_Q and MAT) • Slightly increases R2 (from .58 to .62) • Reduces [C(p) – p] from 2 to .6 • Reduces MSE from .16 to .15 • None of these stats impress me much, I am inclined to take the GRE_Q, MAT model as being best.
Closer Look at MAT, GRE_Q, GRE_V • e: MODEL GPA = GRE_Q GRE_V MAT /STB SCORR2; run;
Keep GRE_V or Not ? • It does not have a significant partial effect in the model, why keep it? • Because it is free info. You get GRE-V and GRE_Q for the same price as GRE_Q along. • Equi donati dentes non inspiciuntur. • As (gift) horses age, their gums recede, making them look long in the tooth.
Add AR ? • R2 increases from .617 to .640 • C(p) = p (always true in full model) • MSE drops from .154 to .150 • Getting AR data is expensive • Stop gather the AR data, unless it has some other value.
Conclusions • Read http://core.ecu.edu/psyc/wuenschk/StatHelp/Stepwise-Voodoo.htm • Treat all claims based on stepwise algorithms as if they were made by Saddam Hussein on a bad day with a headache having a friendly chat with George Bush.