Download
1 / 12
190 likes | 430 Vues
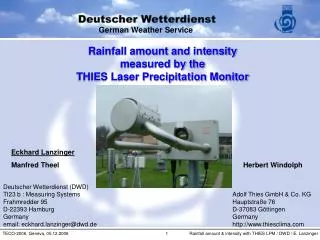
Rainfall amount and intensity measured by the THIES Laser Precipitation Monitor. Eckhard Lanzinger Manfred Theel. Herbert Windolph. Deutscher Wetterdienst (DWD) TI23 b : Measuring Systems Frahmredder 95 D-22393 Hamburg Germany email: eckhard.lanzinger@dwd.de.

E N D
Rainfall amount and intensity measured by the THIES Laser Precipitation Monitor Eckhard Lanzinger Manfred Theel Herbert Windolph Deutscher Wetterdienst (DWD) TI23 b : Measuring Systems Frahmredder 95 D-22393 Hamburg Germany email: eckhard.lanzinger@dwd.de Adolf Thies GmbH & Co. KG Hauptstraße 76 D-37083 Göttingen Germany http://www.thiesclima.com
T Amplitude Diameter Duration Velocity t t Principle of operation light sheet 20 x 228 x 0.75 mm3 receiver light source aspherical lense receiver signal
Factory Calibration • Optical Alignment • Beam Analyser automatically checks width, thickness and alignment of laser light sheet • Volume Calibration • automated calibration bench • precision dispensing pump • droplet generator (accuracy of diameters 2%) • x-y positioning system: 15 positions used • 2-step process: adjustment and final test Measurement uncertainty for volume measurement: 2.2%
LPMOTT Pluvio DFIR GPCC gauges Pit Gauge Experiment • Wasserkuppe • ( Elevation 950 m ) • Manned Weather Station 24h operation • Reference site forGlobal PrecipitationClimate Centre • Test site for sensor intercomparisons
45 40 outlier 35 30 25 Deviation of LPM from pit gauge [mm] 20 15 +20.2% 10 +15% 5 +5.3% 0 -5 0.1 1 10 100 Reference rainfall amount (daily sums) [mm] Rainfall amount
1 Deviation of LPM from pit gauge [mm] 0.5 0 - 0.5 -1 0 0.5 1 1.5 2 Reference rainfall amount (daily sums) [mm] Rainfall amount
Rainfall intensity +19.2 %+31.2 %+37.2 % LPM rainfall intensity [mm/h] Reference rainfall intensity [mm/h]
Overshoots in peaks Rainfall intensity [mm/h] Rainfall intensity Typical time series
Edge Correction A statistical correction has to increase the measured rainfall amount Laser light sheet
LPM 3 LPM 8 LPM 9 Reference Rainfall intensity thin lines = with correction thick lines = without corr. Edge effect is over corrected.Re-Calibrationshould reducedifferencies
Conclusions • The LPMs in this test generally measured too high rainfall amounts and intensities • The deviations increased with increasing intensity (overshoot) • LPM has excellent time response • LPM has very low sensitivity threshold (0.001 mm/h) and thus complements catchment type rain gauges in the low intensity range • Potential to significantly improve the measurements by • improved edge correction • improved calibration