Download
1 / 39
390 likes | 411 Vues
This report examines the impact of Inverted and Active Learning Pedagogies on student success and retention in STEM disciplines. It includes project overview, goals, methodology, data gathering, results, and references from a three-year NSF grant. The study contrasts Inverted versus Traditional courses in Statistics, Biology, Physics, and Chemistry, with faculty involvement and course details outlined. The report also discusses goals, objectives, methodology, data analysis, and dissemination plans for the project findings within the national STEM community.

E N D
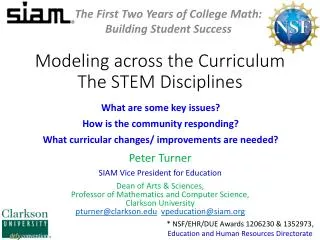
Investigation of Inverted and Active Pedagogies in STEM Disciplines: Final Report Reza O. Abbasian Texas Lutheran University, Department of Mathematics, Computer Science, and Information Systems rabbasian@tlu.edu Michael Czuchry Texas Lutheran University, Department of Psychology mczuchry@tlu.edu
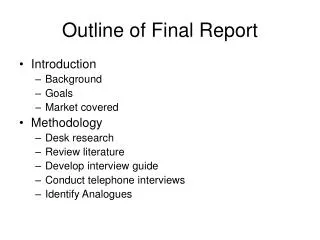
Overview • Description of the project and grant • Goals of the project • Methodology and data gathering • Results • Acknowledgements • References
Description of the project • NSF, IUSE grant • Three years (Fall 2017-Spring 2019), $290K • Study the effectiveness of Inverted classrooms and active learning in STEM disciplines • Inverted versus Traditional courses in Statistics, Biology, Physics, and Chemistry • Faculty involvement: • Six (plus a few unpaid volunteers) faculty managing the grant and teaching the inverted classes, one data analyst and one archivist/web site manager • Courses: STAT 374 - 375, BIOL 143-144, CHEM 143- 144, PHYS 141-142
Goals and Objectives of the projectThe overall goal of the project is to develop, implement and evaluate the impact of the Inverted and Active Learning Pedagogies ( IALP) for Student Success and Retention in STEM disciplines Specific goals: • 1. Develop IALP courses which optimize content coverage and maximize higher-order learning • Summer 2017 workshop(s) to create videos • Summer workshop/presentations for best practices on effective inverted classroom teaching • Summer 2017 : Develop data collection instruments and the management tools to analyze data • Summer 2017: develop pre- and post-tests for each course • Fall 2017 and 2018: Discussion sessions each semester on sharing experiences • December 2017 and 2018, May 2018 and 2019 : Collect data on the results of pre- /post-tests for Inverted and traditional courses and conduct faculty and student surveys.
2. Determine the impact of IALP on the success and retention of STEM majors • Analyze the data at the end of each semester and the cumulative results • Analyze registrar’s data by academic level and major • Determine the impact of IALP courses on the retention rate • Analyze the student surveys to determine the impact of ILAP course satisfaction
3. Disseminate to the national STEM community the projects findings and course material • Disseminate faculty work through presentations and publications • Create an archive of IALP material ( videos, projects, etc.) • Serve as mentors to other universities to replicate and implement the strategies and materials
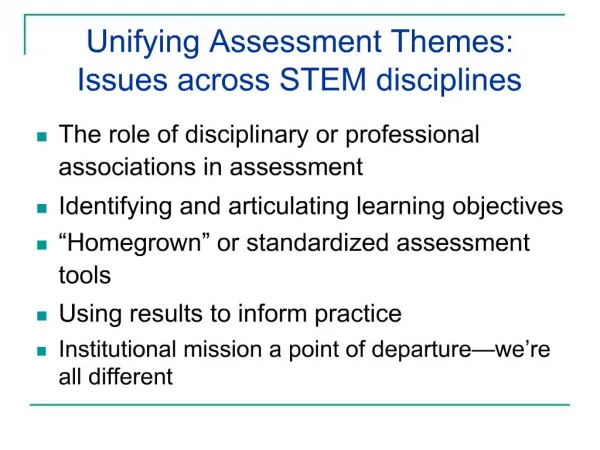
Methodology and Data Gathering • We focused on faculty teaching traditional or inverted/hybrid classes in Statistics, Biology, and Chemistry • We used Bloom’s Taxonomy to create questions at multiple cognitive levels across factual, conceptual, and procedural knowledge domains • Students in all classes were administered the exams at the beginning and end of each semester • Grades and withdrawals over the course of the semester were examined • Student evaluations of classroom activities and preferred method of learning were also examined
Approach for Question Generation Cognitive Dimensions for Multiple-Choice Questions Doing Knowing Interpreting 18 Q 6 Q 6 Q = 30 Questions total Analyze Apply Evaluate Remember Understand Cognitive Dimension 1 3 2 1 3 3 2 1 1 3 3 3 2 1 1
Results • 2X3X2 Mixed MANOVAs were conducted examining pre- post- tests • Condition (Inverted/Hybrid vs. Traditional) • Discipline (Statistics vs. Biology vs. Chemistry) • Time (Beginning of Semester vs. End of Semester) • Dependent variables: • Factual, Conceptual, and Procedural Knowledge • Difference Scores were additionally examined in 2X3 ANOVAS with Condition and Discipline as Independent Variables • Grades and Withdrawals were also examined with 2X3 ANOVAS with Condition and Discipline as Independent Variables
Sample Sizes: Analyses of Pre- Post- Tests Discipline Totals Chemistry Biology Statistics N = 177 N = 60 N = 64 Inverted/Hybrid N = 301 Class Type Traditional N = 210 N = 45 N = 93 N = 348 N = 387 Totals N = 105 N = 157 N = 649
Students Perform Better Over Time, Next Slide (Collapsing Across Disciplines)
Figure 1. Means and Standard Errors for the Percent Correct at the Beginning and End of the Semester. * * * % Correct Notes. *p < .05; Partial Eta Squared = .307; .348; .308, for factual, conceptual, and procedural
Figure 2a. Means and Standard Errors for the Percent Correct for FactualKnowledge at the Beginning and End of the Semester in Biology, Chemistry, and Statistics Classes. * * * % Correct Factual Knowledge Notes. *p < .05; TimeXDiscipline partial eta squared = .151for factual knowledge
Figure 2b. Means and Standard Errors for the Percent Correct for ConceptualKnowledge at the Beginning and End of the Semester in Biology, Chemistry, and Statistics Classes. * * * % Correct Conceptual Knowledge Notes. *p < .05; TimeXDiscipline partial eta squared = .069 for conceptual knowledge
Figure 2c. Means and Standard Errors for the Percent Correct for ProceduralKnowledge at the Beginning and End of the Semester in Biology, Chemistry, and Statistics Classes. * * * % Correct Procedural Knowledge Notes. *p < .05; TimeXDiscipline partial eta squared = .129 for procedural knowledge
Traditional Classes Outperform Inverted/HybridClasses in Some Areas Over Time [Difference Scores]
Figure 3a. Means and Standard Errors for the Percent Change in Factual Knowledge in Inverted/Hybrid Classes across Biology, Chemistry, and Statistics Classes. % Change in Factual Knowledge * Notes. *p < .05 for three-way interaction (difference score depicted); Partial Eta Squared =.009
Figure 3b. Means and Standard Errors for the Percent Change in Conceptual Knowledge in Inverted/Hybrid Classes across Biology, Chemistry, and Statistics Classes. % Change in Conceptual Knowledge p = .051 p = .079 ns Notes. *p = .063 for three-way interaction (difference score depicted); Partial Eta Squared =.009
Figure 3c. Means and Standard Errors for the Percent Change in Procedural Knowledge in Inverted/Hybrid Classes across Biology, Chemistry, and Statistics Classes. % Change in Procedural Knowledge * Notes. *p < .05 for three-way interaction (difference score depicted); Partial Eta Squared =.010
Sample Sizes: Analysis of Final Grades Discipline Totals Chemistry Biology Statistics N = 196 N = 66 N = 83 Inverted/Hybrid N = 345 Class Type Traditional N = 217 N = 46 N = 119 N = 382 N = 413 Totals N = 112 N = 202 N = 727
Figure 4. Means and Standard Errors for Final Grades in Biology, Chemistry, and Statistics. * * Average Grade Received Notes. *p < .05; Partial Eta Squared = .044
Sample Sizes: Analysis of Withdrawals Discipline Totals Chemistry Biology Statistics N = 209 N = 71 N = 86 Inverted/Hybrid N = 366 Class Type Traditional N = 223 N = 56 N = 139 N = 418 N = 432 Totals N = 127 N = 225 N = 784
Figure 5. Means and Standard Errors for Withdrawals in Inverted/Hybrid Classes across Biology, Chemistry, and Statistics classes. Average Proportion of Withdrawals * * Notes. *p < .05; Partial Eta Squared = .017; Chi-Square p =.061, .009, .169 for Biology, Chemistry, Statistics
Effect of Incentive for Pre- Post- Tests Notes: • Factual • p = .000 • Conceptual • p = .076 • Procedural • p = .000
Results: Examining STAT 374 Classes Only • A 2X3 ANOVA was conducted examining total difference score • Condition (Inverted/Hybrid vs. Traditional) • Pell Eligibility (Not Pell Eligible vs. Pell Eligible) • Dependent variables: • Total difference score • Final Grades • Student Survey Items in MANOVA
Sample Sizes: Pell Eligibility, Total Difference Score Pell Eligibility Totals Eligible Not Eligible N = 101 N = 48 N = 149 Inverted/Hybrid Class Type Traditional N = 125 N = 60 N = 185 N = 334 Totals N = 108 N = 226
Figure 6. Means and Standard Errors for Total Percent Gain Scores in Inverted/Hybrid Classes Blocked by Pell Eligibility. Average Total Percent Gain Score * Notes. *p < .05; Partial Eta Squared = .021
Sample Sizes: Pell Eligibility, Grades Pell Eligibility Totals Eligible Not Eligible N = 101 N = 48 N = 149 Inverted/Hybrid Class Type Traditional N = 125 N = 60 N = 185 N = 334 Totals N = 108 N = 226
Figure 7. Means and Standard Errors for Final Grades in Inverted/Hybrid Classes Blocked by Pell Eligibility. * Average GPA Notes. *p < .05, Partial Eta Squared = .026; Interaction p = .056, Partial Eta Squared Interaction = .010
Sample Sizes: Pell Eligibility, Student Survey Items Pell Eligibility Totals Eligible Not Eligible N = 86 N = 39 N = 125 Inverted/Hybrid Class Type Traditional N = 114 N = 58 N = 172 N = 297 Totals N = 97 N = 200
Figure 8. Means and Standard Errors for Student Survey Items in Inverted/Hybrid Classes Blocked by Pell Eligibility. “I Learn Best By…” Agree Strongly * p =.055 * Agree Neither Disagree Disagree Strongly Notes. *p < .05, Partial Eta Squared = .029, .032, .013 for Doing, Listening, and Showing.
Implementation Check • Chi-Square Tests to examine applicability of various strategies across Inverted/Hybrid and Traditional classes. • Video Lectures: Chi-Square (1, N = 309) = 121.984, p < .05, (see next slide) • Other Online Materials: Chi-Square (1, N = 309) = 68.061, p < .05 • Hands-On Interactive Activities in Class: Chi-Square (1, N = 309) = 8.485, p < .05 • General Group Activities in Class: Chi-Square (1, N = 309) = 9.484, p < .05 • Individual Work in Class: Chi-Square (1, N = 309) = 1.420, ns
Summary of Findings • Students demonstrate important learning over time • Students demonstrate important learning over time across disciplines, but particularly in Statistics classes, who earn higher grades overall • Traditional classes demonstrate some relatively minor benefits in some areas • There were fewer withdrawals from students in inverted classes in both Biology and Chemistry classes • There is some evidence that Pell Eligibility was associated with poorer performance in Inverted/Hybrid Classes based on: • Total change scores, grades, self-reported learning styles • Inverted classes were delivering intended pedagogy in expected areas: • Video lectures, other online materials, hands-on interactive work in the classroom, and general group activities in the classroom
Limitations • Students were not randomly assigned to classes and thus many factors influence which class they end up in • Cannot rule out potential impacts of the professor or of classes • The degree to which the class was hybrid or inverted could influence what was observed
Future Work • Examine transfer of learning in sequential classes (e.g., STAT 374 – STAT 375) • Examine faculty surveys on number, type, and length of instructional videos • Examine potential professor effects in STAT 374 classes • Examine the role of technology/software in the classroom
Acknowledgements We would like to thank NSF for the generous funding, all the participating faculty in this grant (Drs. Sauncy, Sieben, Ruane, Davis, Jonas, Lievens, Hijazi, Owenby, Bray, Fuchs, Jean-Francois, Sauncy, Wang, Chupic, Hefner), Jean Constable for institutional data, and additional colleagues at Texas Lutheran University for their support.
References • 1. Maureen Lage, Glenn Platt, Michael Treglia (2000), Inverting the Classroom: A gateway to Creating an Inclusive Learning Environment, Journal of Economic Education • 2. A. Kaw, M. Hess (2007). Comparing Effectiveness of Instructional Delivery Modalities in an Engineering Course Autar Kaw and Melinda Hess, International Journal of Engineering Education, Vol. 23, No. 3, pp. 508-516 • 3. Bergmann, J., & Sams, A. (2012). Flip your classroom: reach every student in every class every day. Washington, DC: International Society for Technology in Education • 4. Clive Thompson (15 Jul 2011), "How Khan Academy is Changing the Rules of Education", Wired • 5. Reza Abbasian & John Sieben“Creating an Inverted Classroom”, ICTCM , Boston, MA, March 2013. • 6. Reza Abbasian & John Sieben“Inverted Classrooms: the What, the Why, the How”, Annual MAA-Texas Section, Lubbock, TX, April 2013. • 7. Reza Abbasian and John Sieben” Inverted classroms: Videos, Sofware, Hardware, Class Activities and Best Practices”