MS/MS spectra interpretation using sequence tags
MS/MS spectra interpretation using sequence tags. Practical course 18.03.2014. Protein ID by partial peptide sequence. Sequence tag: A set of mass values combined with amino acid sequence data is used to identify a protein from a sequence database. sequenziert.


MS/MS spectra interpretation using sequence tags
E N D
Presentation Transcript
MS/MS spectra interpretationusing sequence tags Practical course 18.03.2014
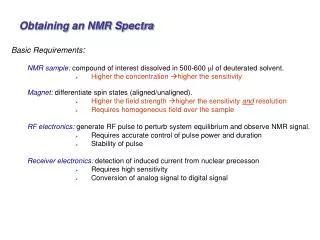
Protein ID by partial peptide sequence • Sequence tag: A set of mass values combined with amino acid sequence data is used to identify a protein from a sequence database sequenziert • Required information from MS/MS spectrum • Peptide mass Mr • m1: start mass • Partial sequence (‘tag’) • m2: stop mass • Additional information • Protein sequence database • Protease specificity • Modifications • Peptide and fragment tolerance
MS/MS interpretation with sequence tags • Example m/z 448.22 z =2 Bei Mascot eingeben m2 Sequence Tag: 3AS m1 Mascot eingeben
MS/MS spectra interpretationusing MS/MS database search Practical course 18.03.2014
Processing of raw MS/MS spectra Bei großen Seuqnezmengen, ist manuelle Suche schwer > automatische Suche mit Mascot Daten müssen zuerst umgewandelt werden. • Performed processing steps • Peak finding • Noise removal • Charge deconvolution(for high S/N peaks) In MS/MS Spektren stehen manchmal Z=? Oder Z=1 dabei. Monoisotopischer Peak ist der höchste Peak ganz links bei Isoptopenverteilung. (bei großen Peptiden ist oft der Peak nicht mehr am höchsten) > Peak Picking = Finden der Monoisotopischen Massen Massengenauigkeit mit 4 Nachkommastellen angeben LC-MS/MS of a peptide digest Peak picking, processing Peaklist Database search Peptide and protein identifications
Example spectrum Raw spectrum Isoptenpeak (dicker) wird rausgefiltert Refined peak picking Processed spectrum Aus 2 fach geladenen Peaks oben werden 1fach geladenen Peaks unten > Vereinfachung Charge deconvolution Noise removal
Peaklist format BEGIN IONS TITLE=9385: Scan 11735 (rt=54.9103) [\\10.152.171.215\msdata3$\thermo_ltq_orbitrap_velos_1\raw\20130226_1ugA431.raw] PEPMASS=650.66896 CHARGE=3+ SCANS=11735 RAWSCANS=sn11735 RTINSECONDS=3294.6174 101.07004 104.27899 102.05279 58.799465 120.08036 94.588662 … …. 1223.629 289.59044 1338.6541 399.54915 1451.7418 380.22103 END IONS Retentionszeit Ab hier Peaklist