REGRESI LINIER SEDERHANA
250 likes | 644 Vues
REGRESI LINIER SEDERHANA. Oleh M. YAHYA AHMAD FAKULTAS PERTANIAN UNIVERSITAS SURYAKANCANA CIANJUR 2007. POKOK BAHASAN. Model Umum Model Populasi Interpretasi Titik Potong Interpretasi Kemiringan Menghitung Koefisien Regresi Pengujian Hipotesis Analisis Hasil. POPULASI. SAMPEL.

REGRESI LINIER SEDERHANA
E N D
Presentation Transcript
REGRESI LINIER SEDERHANA Oleh M. YAHYA AHMAD FAKULTAS PERTANIAN UNIVERSITAS SURYAKANCANA CIANJUR 2007
POKOK BAHASAN • Model Umum • Model Populasi • Interpretasi Titik Potong • Interpretasi Kemiringan • Menghitung Koefisien Regresi • Pengujian Hipotesis • Analisis Hasil
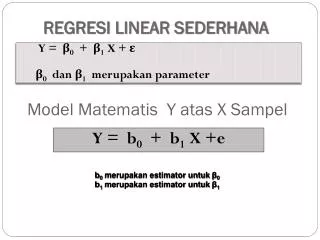
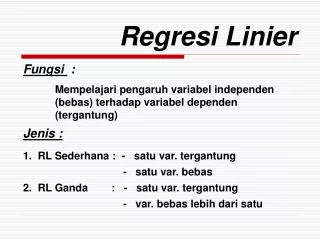
POPULASI SAMPEL REGRESI LINIER SEDERHANA Y = adalah variabel dependent (respons) yang nilainya ditentukan dari rumus persamaan yang terbentuk; misalnya hasil panen, berat tubuh, tingkat serangan hama, dan lain-lain) X = adalah variabel independent (prediktor) yang nilainya tidak ditentukan dari rumus persamaan (misalnya dosis pupuk, panjang tubuh, tingkat kelembaban udara, dll.)
REGRESI LINIER SEDERHANA UNTUK POPULASI Garis regresi population yang merupakan garis lurus yang menggambarkan tingkat ketergantungan satu variabel terhadap variabel lainnya) Nilai Titik potong garis regresi dengan sumbu Y Galat Koefisien kemiringan (slope) Variabel Dependen (Response) Variabel Independen (Predictor, explanatory) Garis Regresi Populasi (conditional mean)
REGRESI LINIER SEDERHANA UNTUK SAMPEL Garis regresi Sampel merupakan suatu nilai taksiran (estimate) dari garis regresi populasi dan merupakan nilai taksiran untuk variabel Y Koefisien kemiringan (Slope) Titik potong (intercept) dengan sumbu Y Galat sampel Garis regresi sampel (Garis regresi yang diplotkan, nilai taksiran)
Interpretasi Untuk Titik Potong (Intercept) • boadalah nilai taksiran (estimate) rerata nilai Y jika nilai X sama dengan nol.
INTERPRETASI UNTUK KOEFISIEN KEMIRINGAN (SLOPE) b1 adalah ni;ai taksiran perubahan dalam rata-rata nilai Y sebagai hasi dari perubahan satu nilai X dalam satu satuan perubahan nilai X
KOEFISIEN KORELASI (RUMUS TEORITIS)
Inferensial Slope: Uji-t • Uji-t untuk slope populasi • Apakah ada ketergantungan secara linier untuk Y terhadap X ? • Hipotesis Nol dan Hipotesis Tandingan • H0: 1 = 0 (tidak ada ketergantungan linear) • H1: 1 0 (Terdapat ketergantungan linear) • Statistik Uji
H0: 1 = 0 H1: 1 0 .05 df7 - 2 = 5 Nilai Kritis: Inferensial tentang Slope: Teladan Uji-t Statistik Uji: Keputusan: Kesimpulan: Dari Hasil Cetak Excel Reject H0 TolaK Tolak .025 .025 Terdapat bukti bahwa luas toko berpengaruh terhadap penjualan tahunan. t -2.5706 0 2.5706
Uji Hubungan Linear • Hipotesis • H0: = 0 (tidak ada korelasi) • H1: 0 (Terdapat korelasi) • Sttatistik Uji
Uji Hubungan Linier r Dari Hasil Cetakan Excel Apakah ada hubungan linier antara penjualan tahuan sutu toko dengan luas toko tersebut pada taraf .05? H0: = 0 (Tidak ada hubungan) H1: 0 (Terdapat Hubungan ) .05 df 7 - 2 = 5