Download
1 / 49
500 likes | 716 Vues
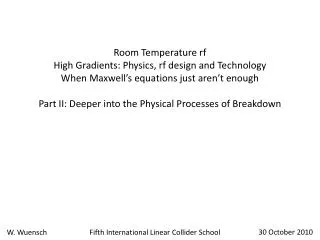
Room Temperature rf High Gradients: Physics, rf design and Technology When Maxwell’s equations just aren’t enough Part II: Deeper into the Physical P rocesses of Breakdown.

E N D
Room Temperature rf High Gradients: Physics, rf design and Technology When Maxwell’s equations just aren’t enough Part II: Deeper into the Physical Processes of Breakdown
Before we try to understand breakdown in an rf cavity, we will look in depth into the physics of breakdown – a spark if you will. I will start by introducing the overall multi-step and multi-scale picture of breakdown, the big picture – this will be shocking. Then we cover the individual steps in more detail all the while looking back at the big picture. This chapter will primarily refer to dc sparks. This is partly because we can understand a simple system better and partly because most of the detailed work on breakdown is for dc. Almost everything presented in this section applies to rf. The next section will then take those ideas and apply them in an rf cavity.
Breakdown trigger Charges collect at cathode non-uniformities under applied electric field [fs, nm] Structure of surface modified under time/cycles [s, 107 pulses, nm] Structure of surface modified under time/cycles [s, 107 pulses, nm] Field (and thermionic) emission Tensile electric stress [fs, nm] Local joule heating [ns, m] (from plasma feeding) Avalanche starts Thermal stress Field enhanced evaporation of neutrals Plasma spot forms [few ns, 10-100’s of m] ionization electrons are accelerated away from cathode [mm] Ionization Plasma dynamics Plasma sheath forms [m] Plasma feeding process enhanced electron emission due to sheath potential and temperature surface melts due to ion bombardment [10-100’s of m] Ions are accelerated towards cathode [m] Ions strike cathode and kick out neutrals, ions and electrons enhanced neutral emission, plasma feeding accelerates Electron current accelerated in external field absorbs system energy [mm] Macroscopic energy transfer (go to plasma dynamics)
Breakdown trigger Charges collect at cathode non-uniformities under applied electric field [fs, nm] Structure of surface modified under time/cycles [s, 107 pulses, nm] Structure of surface modified under time/cycles [s, 107 pulses, nm] Field (and thermionic) emission Tensile electric stress [fs, nm] Local joule heating [ns, m] (from plasma feeding) Avalanche starts Thermal stress Field enhanced evaporation of neutrals Plasma spot forms [few ns, 10-100’s of m] ionization electrons are accelerated away from cathode [mm] Ionization Plasma dynamics Plasma sheath forms [m] Plasma feeding process enhanced electron emission due to sheath potential and temperature surface melts due to ion bombardment [10-100’s of m] Ions are accelerated towards cathode [m] Ions strike cathode and kick out neutrals, ions and electrons enhanced neutral emission, plasma feeding accelerates Electron current accelerated in external field absorbs system energy [mm] Macroscopic energy transfer (go to plasma dynamics)
Vacuum breakdowns, the kind relevant for rf cavities, start on the negatively charged electrode – the cathode. The main physical effect on the cathode which drives the breakdown is field emission , electron currents which tunnel out of the surface due to the applied electric field, which we have already seen in dark current. The field emission current flows through discrete locations on the surface called emission sites, the origin of which we will discuss later but they are very small. The current heats the area around the emission site according to the same formulas we saw for pulsed surface heating – but current densities are much higher and we can easily go near the melting point of a metal surface.
Now we look in more detail at the physics of field emission. Electron emission from a surface due to an applied electric field is described by the Fowler-Nordheim relation. The basic physics contained in the equation describes the tunneling of electrons through the surface potential barrier. The validity of the equation has been verified in nm-scale sharp tips such as those used in scanning tunneling microscopes for example But correction factors must be applied to macroscopic metal surfaces because we see enhanced emission from surface non-uniformities. We’ll return to this fact-of-life later.
The surface potential used for solving the Fowler-Nordheim equation { -Wa for z<0 -eEz-e2/4z for z>0 V(z)=
The Fowler-Nordheim equation (approximate, practical form) Units: [I]=A, [E]=MV/m, [Ae]=m2, []=eV and []=dimensionless Values: = 4.5 eV for copper
Crazy little thing called … If you measure emission from real, macroscopic metal surfaces – like you see in rf cavities and dc spark systems - you see that the Fowler Nordheim equation works perfectly except that you need to multiply the electric field by a factor typically of 30-100 to get the thing to fit. This “minor” discrepancy is caused by the local surface non-uniformities I have referred to . They are usually attributed to dirt particles or microscopic tips which give a local electric field enhancement factor. But certain chemical contaminants and crystal dislocations can lower the work function and enhance field emission.
The Fowler-Nordheim equation Analyzing real data - You will have the opportunity to analyze a real set of data tonight for homework!
However high features are rarely, if ever, observed independently of field emission. Specifically the expected field enhancements samples are not predicted, from electron microscope images. Part of the answer may that the emission sites are small, nm size. In fact we get nm scale by fitting the FN equation in our dc spark tests assuming the origin are tips. Why are we spending so much time on one box of the diagram? The practical consequences of enhanced field emission are significant – we should be able to handle ≈ 10 GV/m surface fields but we can only manage ≈ 200 MV/m.
Also a large part of conditioning occurs with E constant, with gains in E obtained through reduction in . A typical measured value of E near the breakdown limit for copper is 8 GV/m - alternatively this is 1 eV/Å. To get an idea of the scale, the cohesive energy of a Cu atom in a crystal is 3.46 eV/atom and the inter-atomic spacing is 3.6 Å, hence… So extracting from the IV characteristics of a surface is important experimental exercise, and understanding where it comes from an important exercise for the field!
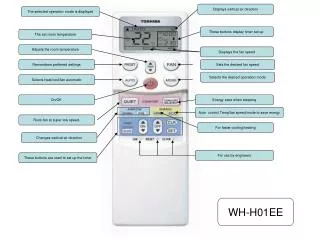
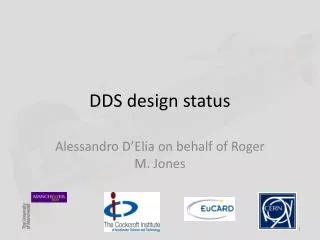
Experimental set-up : ‘‘ the spark system ’’ vacuum chamber (UHV 10-10 mbar) HV switch HV switch m-displacement gap 10 - 50 mm (±1 mm) 20 mm typically anode (rounded tip, Ø 2 mm) power supply (up to 15 kV) V spark C (28 nF) cathode (plane) • Two similar systems are running in parallel • Types of measurements : Field Emission ( b) Conditioning ( breakdown field Eb) Breakdown Rate ( BDR vs E)
Modelling DC discharges ~ 4-6 kV • First we have to understand breakdowns in DC, before we can generalise to RF • Simple and cost-efficient testing of breakdown behaviour with twoDC setups at CERN • We adjusted also out theoretical model to the DC experimental conditions • However, results are completely general! r=1 mm d=20 μm e.g. Cu
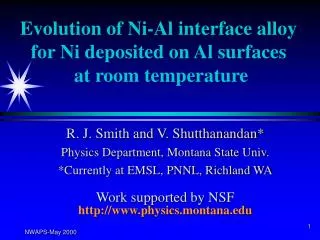
b · Eb = cst b↔ next Eb correlation b↔ previous Eb no correlation Evolution of b & Eb during conditioning experiments • Measurements of b after each sparks (Cu electrodes) Antoine Descoeudres
An example of the same thing in an rf cavity T. Higo, KEK Test of TD18
Identifying the origin of , and finding a way of independently verifying it, is one of the big open issues in breakdown R&D. Reducing it is a goal for practical applications. Dirt and dust clearly cause emission sites in early conditioning, and this is the dominant effect in the low, <100 MV/m surface fields in superconducting cavities. But there seems to be a unique limiting gradient for each material – see next slide – which must have an explanation in the intrinsic properties of the material. But to go further, we need to look at what else happens when we have field emission to understand how we go from field emission to breakdown.
Conditioning curves of pure metals Antoine Descoeudres
Now we are going to discuss the next step – how and why field emission evolves into a breakdown. The requirements for a low – 10-7 – breakdown rate in a linear collider gives us a unique perspective on breakdown. (We have O(105) structures rf units in CLIC so if we don’t want to lose more than 1% luminosity to breakdown we have to have a breakdown rate of O(10-7)) We need to answer not just the question “Why does a surface breakdown?” but also “Why does it breakdown sometimes?” Trying to answer this question is leading us to new insights into the breakdown mechanism. Another look at the big picture…
Breakdown trigger Charges collect at cathode non-uniformities under applied electric field [fs, nm] Structure of surface modified under time/cycles [s, 107 pulses, nm] Structure of surface modified under time/cycles [s, 107 pulses, nm] Field (and thermionic) emission Tensile electric stress [fs, nm] Local joule heating [ns, m] (from plasma feeding) Avalanche starts Thermal stress Field enhanced evaporation of neutrals Plasma spot forms [few ns, 10-100’s of m] ionization electrons are accelerated away from cathode [mm] Ionization Plasma dynamics Plasma sheath forms [m] Plasma feeding process enhanced electron emission due to sheath potential and temperature surface melts due to ion bombardment [10-100’s of m] Ions are accelerated towards cathode [m] Ions strike cathode and kick out neutrals, ions and electrons enhanced neutral emission, plasma feeding accelerates Electron current accelerated in external field absorbs system energy [mm] Macroscopic energy transfer (go to plasma dynamics)
The breakdown rate issue Let’s look at the dependence of breakdown rate on gradient. This is a standard plot for linear collider high-gradient tests and we also measure it in dc. E29? Exponential? Very strong for sure. Having a practical goal, we also ask “How can we influence it?” To do this we need to understand the nature of the breakdown trigger but also the origin of its statistical nature.
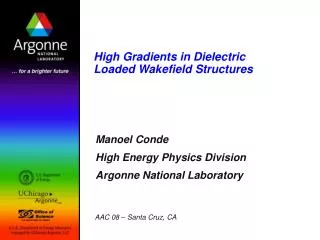
CERN/KEK/SLAC T18 structure tests Lines are E30/BDR=const SLAC 2 SLAC 1 KEK rf test results have been presented in detail at the X-band workshop, Monday morning, with a summary by S. Doebert on Wednesday morning.
g = power in the fit BDR ~ Eg Breakdown Rate : DC & RF (30 GHz) Same trend in DC and in RF, but difficult to compare ‘slopes’
n.b. The breakdown rate over the long term is directly determined by the trigger mechanism but it can also be influenced indirectly by the damage caused by previous breakdowns. For example: more damage, higher , higher local surface field, higher breakdown rate. Lack of clarity in the distinction between what causes the breakdown and what the breakdown causes often results in confusion.
The two aspects of the breakdown trigger 1. How does the electric field pulse affect the surface when there is no breakdown? How does this surface modification lead to an increase the level of field emission to get to the critical value? Of course we would like to identify the origin of the enhanced emission in the first place. These steps are highlighted in yellow in the big picture. 2. What happens when you reach the critical value, what other physical processes to kick in? These steps are highlighted in blue.
Breakdown trigger Charges collect at cathode non-uniformities under applied electric field [fs, nm] Structure of surface modified under time/cycles [s, 107 pulses, nm] Structure of surface modified under time/cycles [s, 107 pulses, nm] Field (and thermionic) emission Tensile electric stress [fs, nm] Local joule heating [ns, m] (from plasma feeding) Avalanche starts Thermal stress Field enhanced evaporation of neutrals Plasma spot forms [few ns, 10-100’s of m] ionization electrons are accelerated away from cathode [mm] Ionization Plasma dynamics Plasma sheath forms [m] Plasma feeding process enhanced electron emission due to sheath potential and temperature surface melts due to ion bombardment [10-100’s of m] Ions are accelerated towards cathode [m] Ions strike cathode and kick out neutrals, ions and electrons enhanced neutral emission, plasma feeding accelerates Electron current accelerated in external field absorbs system energy [mm] Macroscopic energy transfer (go to plasma dynamics)
Evidence that increases cumulatively from pulse to pulse, with breakdown occurring when a critical value is reached, can be see in the next slide. Breakdown rate comes from the growth rate of the surface features. Not to be forgotten that there are potentially many emission sites on a surface, so the story of our rf structure is not that of a single site. Please note that we are now entering an area of active research – I look to one of you to tell me the answer.
b·E = 10.8 GV/m length and occurence of breakdown clusters ↔ evolution of b Evolution of b during BDR measurements (Cu) spark • breakdown as soon as b > 48 ( ↔ b · 225 MV/m > 10.8 GV/m) • consecutive breakdowns as long as b > bthreshold Antoine Descoeudres
The two main classes of ideas on how the surface evolves in a way that field emission increases are, 1. Tip growth – geometrical field enhancement factor becomes larger. 2. Dislocation movement – local work function becomes lower and atomic level surface geometry can change. Experimental evidence from this is on the next slide. It is quite possible that both processes occur.
hcp fcc : face-centered cubic bcc : body-centered cubic hcp : hexagonal closest packing bcc hcp bcc bcc bcc bcc bcc fcc fcc Breakdown field of materials (after conditioning) • In addition to other properties, also importance of crystal structure? • reminder : Cu < W < Mo same ranking as in RF tests (30 GHz) Antoine Descoeudres
More specifics on the ideas of breakdown rate Geometric growth of the tips under induced stress, both electric field tension and thermal stress from emission current Joule heating. Crystal dislocations do act a nucleation points for whisker growth in certain conditions. Accumulation of defects under stress, again both electric field tension and thermal stress - fatigue. Like in pulsed surface heating. Tips eventually form cracks and break off. Defects are also areas of lower work function. This is very hard to calculate or measure (but I have the personal belief that this must be important). Alternative - Migration of hydrogen atoms to the surface. Presence of hydrogen from the bulk could enhance evaporation and accelerate the trigger process. Clearer in next section.
+ + + + + + + + Stage 3a: Onset of tip growth • Presence of an electric field exerts a tensile stress on the surface • Presence of a near-to-surface void may trigger the growth of a protrusion → Fel Force STRESS =0E2/Y Fixedatoms Submitted to PRB: Rapid Commun., A. S. Pohjonen, F. Djurabekova, A. Kuronen, and K. Nordlund, “Dislocation nucleation from near surface void under static tensile stress in Cu”
Wöhler curves for various types of copper relevant for rf cavities Around 5% per decade! Stress goes as E2 From SamuliHeikkinen
Now what else starts to kick in as our emission sites evolve – back to the blue box in the big picture: Field enhanced evaporation of neutrals – The field emission current densities give temperature rises near the melting point. Evaporation occurs. The applied field polarizes atoms in the crystal, pulls on them, and evaporation is enhanced. Alternative explanation - Detachment of atomic clusters through a fatigue-like process – the electrostatic tensile force induced by 8 GV/m is of the order of the tensile strength of copper.
Electric field induced tensile force rewriting for our units The ultimate tensile strength of Cu is 220 Mpa and the measured E is typically 8 GeV…
+ + + + + + + + Stage 2: Hybrid ED&MD • Atoms move according to the Molecular dynamics algorithm, solving Newton’s equations of motion • In ED&MD hybrid code, due to the excess or depletion of electron density (atomic charge), we apply Gauss’s law to calculate the charges for the surface atoms ; • Floc is a solution of Laplace equation Thus, the motion of surface atoms is corrected due to the pulling effect of the electric field
↑E0 Je Emax Je Stage 2: Dynamics of electrons for temperature account • At such high electric fields, field emission is a non-negligible phenomenon • Electrons escaping from the surface with significant current will heat the sharp features on the surface, causing eventually their melting. • The change of temperature (kinetic energy) due to Joule heating and heat conduction is calculated by the 1D heat equation Results are submitted to Comput. Mater. Sci., S. Parviainen, F. Djurabekova, H. Timko, and K. Nordlund, “Implementation of electronic processes into MD simulations of nanoscale metal tips under electric fields “
The crucial next step is that the liberated atoms are ionized by the field emission current that is accelerating away from the cathode. These positively charged ions then turn around and accelerate towards the surface, strike it and sputter away more atoms. We are now forming a plasma and the whole thing starts to run away. Currents rise 12-15 orders of magnitude from p/nA to kA, we see light, X-rays, melt spots on the surface, capacitors discharge, rf power is absorbed etc. We would need more time to cover these stages of the breakdown. I can refer you to an excellent book called “Cathodic arcs” by Andre Anders.
Breakdown trigger Charges collect at cathode non-uniformities under applied electric field [fs, nm] Structure of surface modified under time/cycles [s, 107 pulses, nm] Structure of surface modified under time/cycles [s, 107 pulses, nm] Field (and thermionic) emission Tensile electric stress [fs, nm] Local joule heating [ns, m] (from plasma feeding) Avalanche starts Thermal stress Field enhanced evaporation of neutrals Plasma spot forms [few ns, 10-100’s of m] ionization electrons are accelerated away from cathode [mm] Ionization Plasma dynamics Plasma sheath forms [m] Plasma feeding process enhanced electron emission due to sheath potential and temperature surface melts due to ion bombardment [10-100’s of m] Ions are accelerated towards cathode [m] Ions strike cathode and kick out neutrals, ions and electrons enhanced neutral emission, plasma feeding accelerates Electron current accelerated in external field absorbs system energy [mm] Macroscopic energy transfer (go to plasma dynamics)
Stage 4: Plasmaevolution ~ 4-6 kV Corresponding to experiment... • 1d3v electrostatic PIC-MCC code • Resolving the main stream of plasma • Areal densities of physical quantities r=1 mm d=20 μm • Exponential voltage drop mimicked • Limited energy from the circuit Cu Accepted for publication in Contrib. Plasma Phys., H. Timko, K. Matyash, R. Schneider, F. Djurabekova, K. Nordlund, A. Hansen, A. Descoeudres, J. Kovermann, A. Grudiev, W. Wuensch, S. Calatroni, and M. Taborelli , “A One-Dimensional Particle-in-Cell Model of Plasma Build-up in Vacuum Arcs”
Under what conditions will an arc form? Two conditions need to be fulfilled:( scaling btw. DC and RF) • High enough initial local field to have growing FE current • Reaching acritical neutral density ionisation avalanche • The sequence of events leading to plasma formation: • ”Point of no return”: lmfp < lsys – corresponding to a critical neutral density ~ 1018 1/cm3 in our case ionisation avalanche High electric field Electron emission, neutral evaporation Ionisation e–, Cu and Cu+ densities build up Sputtering neutrals
Stage 5: Cathode damage due to ion bombardment • Knowing flux & energy distribution of incident ions, erosion and sputtering was simulated with MD • Flux of ~1025 cm-2s-1 on e.g. r=15 nm circle 1 ion/20 fs H. Timko, F. Djurabekova, K. Nordlund, L. Costelle, K. Matyash, R. Schneider, A. Toerklep, G. Arnau-Izquierdo, A. Descoeudres, S. Calatroni, M. Taborelli , and W. Wuensch, “Mechanism of surface modification in the plasma-surface interaction in electrical arcs”, Phys. Rev. B 81, 184109 (2010)
Comparison to experiment • Self-similarity: Crater depth to width ratio remains constant over several orders of magnitude, and is the same for experiment and simulation 10 μm 50 nm