Download
1 / 21
210 likes | 335 Vues
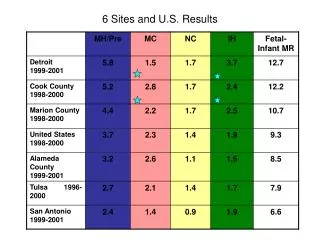
6 Sites and U.S. Results. PPOR Map of Feto-Infant Mortality Among Births to Bexar County Mothers 1999 - 2001. Total Feto-Infant Deaths 479. Total Fetal Deaths and Live Births 71,753. Source: San Antonio Metropolitan Health District and Texas Department of Health.

E N D
PPOR Map of Feto-Infant Mortality Among Births to Bexar County Mothers 1999 - 2001 Total Feto-Infant Deaths 479 Total Fetal Deaths and Live Births 71,753 Source:San Antonio Metropolitan Health District and Texas Department of Health
PPOR Map of Feto-Infant Mortality Among Births to Bexar County Mothers 1999 - 2001 Fetal Death Post- neonatal Neonatal 172 500-1499 g 103 67 137 1500+ g Source:San Antonio Metropolitan Health District and Texas Department of Health
PPOR Map of Feto-Infant Mortality Among Births to Bexar County Mothers 1999 - 2001 Fetal Death Post- neonatal Neonatal Maternal Health/Prematurity 2.4 500-1499 g Maternal Care 1.4 Newborn Care .93 Infant Health 1.9 1500+ g Source:San Antonio Metropolitan Health District and Texas Department of Health
San Antonio, Texas PPOR 1999-2001 San Antonio Total Deaths 1999-2001 = 479
Maternal Health/ Prematurity 210/3.2 MaternalCare 167/2.6 Newborn Care 74/1.1 Infant Health 101/1.6 Overall Distribution and Rates of Fetal-Infant Mortality Alameda County, 1999-2001 552 total deaths 64,492 total births Rate=8.5 deaths per 1,000 births
Maternal Health/ Prematurity 7.1 vs 2.4 MaternalCare 4.6 vs 2.2 Newborn Care 1.3 vs 1.5 Infant Health 3.0 vs 0.9 Fetal-Infant Mortality Rates by Race African American vs White, Alameda County 1999-2001 Total Rate: 16.1 vs 7.1
Maternal Health/ Prematurity 7.1 vs 1.9 MaternalCare 4.6 vs 1.9 Newborn Care 1.3 vs 1.0 Infant Health 3.0 vs 1.0 Fetal-Infant Mortality Rates African American vs Internal Reference Group: Asian women 20+, 13+ yrs education, Alameda County 1999-2001 Total Rate: 16.1 vs 5.9
Alameda County PPOR 1999-2001 Alameda Total Deaths 1999-2001 = 552
Maternal Health/ Prematurity 244/5.8 MaternalCare 63/1.5 Newborn Care 72/1.7 Infant Health 158/3.7 Overall Distribution and Rates of Fetal-Infant Mortality City of Detroit, 1999-2001 537 total deaths 42,177 total births Rate=12.7 deaths per 1,000 births 1999-2001 Birth Cohort Prepared by: DHWP-FHS on 3/15/04 For internal planning use only.
Maternal Health/ Prematurity 6.2 vs 3.7 MaternalCare 1.3 vs 2.4 Newborn Care 1.7 vs 1.8 Infant Health 4.0 vs 2.9 Fetal-Infant Mortality Rates by Race Black American vs White American , Detroit 1999-2001 Total Rate: 13.1 vs 10.7 1999-2001 Birth Cohort Prepared by: DHWP-FHS on 3/15/04 For internal planning use only.
Detroit PPOR 1999-2001 Detroit Total Deaths 1999-2001 = 537
Total Stillbirths, Fetal and Infant Deaths Meeting PPOR Model Criteria, 1996-2000: t Tulsa County Residents Fetal Losses & Stillbirths: Live Births: 24 weeks gestation - > 24 weeks gestation 29 - 365 days of life 28 days of life Maternal Health/Prematurity 2.67 500-1499 grams (1 lb 1.5 oz - 3 lbs 4 oz) per 1000 eligible live and stillbirths 119 Deaths Birth Weight > 24 weeks gestation 24 weeks gestation - 28 days of life 29 - 365 days of life (fetal losses & stillbirths) Maternal Care Newborn Care Infant Health 2.13 1.41 1.66 1500 grams 3 lbs 5 oz) 95 Deaths 63 Deaths 74 Deaths > ( > OVERALL IMR = 7.88 Total = 351 Deaths Denominator = 44,571 t t t (Sum of 4 Blocks) (Sum of 4 Blocks) (reported live births, stillbirths and fetal losses > 500 grams and > 24 weeks gestation) 130 Excluded Birth Outcomes (< 500 grams and/or < 24 weeks gestation)
Total Stillbirths, Fetal and Infant Deaths Meeting PPOR Model Criteria, 1996-2000: t Tulsa County Residents by Race Fetal Losses & Stillbirths: Live Births: 24 weeks gestation - > 24 weeks gestation 29 - 365 days of life 28 days of life Maternal Health/Prematurity Number Rate 3 lbs 4 oz) 500-1499 grams 2.66 White 90 5.30 Black 35 2.85 Native American 8 < ( 4.59 Hispanic 16 1.12 Other 1 Birth Weight > 24 weeks gestation 24 weeks gestation - 28 days of life 29 - 365 days of life (fetal losses & stillbirths) Maternal Care Newborn Care Infant Health Number Rate Number Rate Number Rate 1500 grams 1.89 1.80 1.65 3 lbs 5 oz) White 64 White 61 White 56 3.03 2.27 3.03 Black 20 Black 15 Black 20 Native American 8 Native American 3 Native American 9 2.85 1.07 3.21 > ( 3.37 0.86 2.01 Other 3 Hispanic 3 Hispanic 7 > 8.89 2.25 1.12 Hispanic 31 Other 2 Other 1 WHITE IMR = 13.62 White Total = 90 Deaths White Denominator = 33867 t t t BLACK IMR = 9.98 Black Total = 28 Deaths Black Denominator = 6607 t t t NAT. AMERICAN IMR = 10.83 Nat. Am. Total = 29 Deaths Nat. American Denominator = 2807 t t t HISPANIC IMR = 16.34 Hispanic Total = 57 Deaths Hispanic Denominator = 3488 t t t OTHER IMR = 7.87 Other Total = 7 Deaths Other Denominator = 889 t t t (Sum of 4 Blocks) (Sum of 4 Blocks) (reported live births, stillbirths and fetal losses > 500 grams and > 24 weeks gestation) 130 Excluded Birth Outcomes (< 500 grams and/or < 24 weeks gestation) Race and Hispanic Ethnicity determined by mother's race and ethnicity as coded on the birth certificate. NOTE: Some deaths may be included in a race category as well as in the Hispanic ethnicity catagory.
Tulsa, Oklahoma PPOR 1996-2000 Tulsa Total Deaths 1996-2000 = 351
Fetal-Infant Mortality Rates* All races, Marion County, Indiana 1998-2000 Age at Death Fetal Neonatal Post Neonatal Fetal Neonatal Post Neonatal Birthweight 500-1499 grams 1500+ grams Fetal Infant Mortality Rate=10.7 per 1,000 458 Fetal-Infant Deaths 42778 Fetal Deaths and Live Births
Fetal-Infant Mortality Rates** Reference Group*** Age at Death Fetal Neonatal Post Neonatal Birthweight 500-1499 grams 1500+ grams Fetal Infant Mortality Rate= 5.9 per 1,000 82 Fetal-Infant Deaths 13805 Fetal Deaths and Live Births *Note: Over 10% imputed combined deaths, 10% or more imputed fetal deaths. Units with 10% or more imputed deaths overall were considered having major reporting problems. ** Source, NCHS data, 1998-2000 Calculations by CityMatCH *** Reference group consists of non-Hispanic, white women with at least 13 years of education by residence at time of birth or fetal death (national standard).
Marion County PPOR 1998-2000 Marion County Total Deaths 1998-2000 = 458
Maternal Health/ Prematurity 1344/5.2 MaternalCare 729/2.8 Newborn Care 426/1.7 Infant Health 619/2.4 Overall Distribution and Rates of Fetal-Infant Mortality Cook County, IL 1998-2000 3,018 total deaths 255,573 total births Rate=12.2 deaths per 1,000 births
Cook County, Illinois PPOR 1998-2000 Cook County Total Deaths 1998-2000 = 3,018