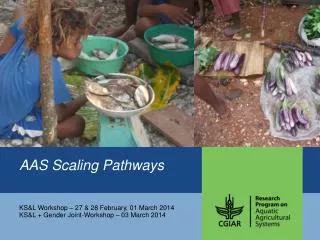
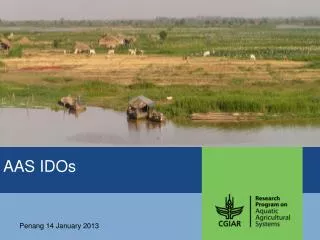
AAS IDOs
AAS IDOs. Penang 14 January 2013. System CRPs. Origin: SRF and system CRPs. “ Agricultural production system research should increase and progressively become the focal point for the integration of commodity and natural resources research. ” (CGIAR SRF 2011). STRATEGY AND RESULTS FRAMEWORK.

AAS IDOs
E N D
Presentation Transcript
AAS IDOs Penang 14 January 2013
Origin: SRF and system CRPs • “Agricultural production system research should increase and progressively become the focal point for the integration of commodity and natural resources research.” (CGIAR SRF 2011)
STRATEGY AND RESULTS FRAMEWORK The SRF (CGIAR 2011) advocates three additional areas of core competency to accomplish impact on the four strategic outcomes and to respond to the principal drivers of change in agricultural systems. Production Systems: The CGIAR’s research on production systems has been episodic, has rarely extended beyond research on mandate cropping systems, and has lacked the methodologies for research at a production system level Development of core competency in the area of production systems will test the ability of the system to undertake inter-center research.
Rural poverty Number of rural poor (millions) (<US$1.25 per day)
Moving beyond the Green Revolution • “… there are serious and growing threats to the productivity and resilience of the Green Revolution lands. Equitability has also been low. The larger landowners have reaped most of the benefits, while the poor and landless have missed out.” (Conway 2012)
System CRPs – differentiators • Place and people - untapped potential • Systems thinking and analysis • Multidimensional nature of poverty • Innovation and adaptation to leverage change • Working at multiple scales • Explicit focus on scaling in complex systems
Common IDOs Material Outcomes Income Access to food Nutrition Productivity Control of assets Capacity to innovate Instrumental Outcomes Capacity to adapt Future options Policies Environment Climate
AAS IDOs Material Outcomes • Increased and more equitable income from agricultural and natural resources management and environmental services earned by low income value chain actors • Improved diet quality of nutritionally-vulnerable populations, especially women and children Instrumental Outcomes • Improved productivity in pro-poor food systems • Increased control over resources and participation in decision-making by women and other marginalized groups • Increased capacity for innovation within low income and vulnerable rural communities allowing them to improve livelihoods • Increased capacity in low income communities to adapt to environmental and economic variability, shocks and longer term changes
Our numbers Direct • Communities and households in each hub • Community-community learning • Scaling via partners working in the hubs Scaling • 25% of poor dependent on four focal systems • to be refined with development partners
Bangladesh Southern Polder Zone (1.8m) • AAS innovation households (76 innovation villages with 200 households in each = 15,200hh) = 76,000 people (discounted at 50% = 38,000) • AAS adjacent households (1520 villages with 50 households in each = 76,000hh) = 380,000 people (discounted at 50% = 190,000) • Partner innovation households (1940 innovation villages with 150 households in each = 291,000hh) = 1,455,000 people (discounted at 25% = 363,750) • Partner adjacent households (19,400 villages with 50 households in each = 970,000hh) = 4,850,000 people (discounted at 25% = 1,212,500
Global Development Institutions • Regional development institutions • National and local Governments • Global + regional science networks • International NGOs AAS – Partners and pathways to scale • National and local Governments • NARS • NGOs (national and international) • Other research partners • Private sector • Local Government • NARS • Community Organizations + NGOs • Other research partners • Private sector
Questions • Are the IDO numbers credible given our current understanding of the scaling pathways? • What are the assumptions behind them – including for partnerships? • What do we need to do to agree and confirm targets this year (incl. stakeholders)?
Bangladesh Southern Polder Zone (1.8m) • AAS innovation households (76 innovation villages with 200 households in each = 15,200hh) = 76,000 people (discounted at 50% = 38,000) • AAS adjacent households (1520 villages with 50 households in each = 76,000hh) = 380,000 people (discounted at 50% = 190,000) • Partner innovation households (1940 innovation villages with 150 households in each = 291,000hh) = 1,455,000 people (discounted at 25% = 363,750) • Partner adjacent households (19,400 villages with 50 households in each = 970,000hh) = 4,850,000 people (discounted at 25% = 1,212,500
Zambia Barotse (160,000) AAS innovation villages • 10 villages x 150hh = 1500hh = 9000 people (Year 1) • 5 villages x 150hh = 6750hh = 4500 people (Year 2-9) • Total over 10 years = 8250hh = 49,800 people AAS adjacent villages • 85 villages x 50hh = 4250 (10 years) = 25,500 people Partner innovation and adjacent villages • 50 villages x 50hh (Year 1) 25 villages (Years 2-9) x 50hh = 13,750hh = 82,500 people
Cambodia Cambodia • Tonle Sap = 100,000 households (discounted at 75% = 375,000 people) Philippines • VizMin = 70,000 households (= 420,000 people) Solomons • 10,000 households direct engagement (=50,000 people) • 15,000 households scaling (=75,000 people) • Total = 125,000 people
Geographical Focus Asia mega deltas African Inland GBM* The Coral Triangle Mekong Niger Lakes Victoria-Kyoga Zambezi African Coastal South Pacific Community • High numbers of poor and/or • High % of total population dependent on AAS • High vulnerability to change (climate/sea level/water) • Potential to scale out (where learning from Coral Triangle will be scaled out) Population living on <$1.25/day, per grid cell (resolution : 9 km at the equator) *GBM: Ganges-Brahmaputra-Megna delta Source of poverty map: CGIAR SRF Domain Analysis Spatial Team (2009)
People using AAS Source: Bené & Teoh, in prep.