Advanced GIS
Advanced GIS. Topic 1 Starting Jan. 16, 2007. Outlines. About the class setting Materials to be covered and scheduled Quick review of GIS basics First lab. Materials to be covered and scheduled . Review (week 1,2) Geodatabase lab 1 Spatial data analysis (3,4,5)

Advanced GIS
E N D
Presentation Transcript
Advanced GIS Topic 1 Starting Jan. 16, 2007
Outlines • About the class setting • Materials to be covered and scheduled • Quick review of GIS basics • First lab
Materials to be covered and scheduled • Review (week 1,2) • Geodatabase lab 1 • Spatial data analysis (3,4,5) • Vector data analysis (lab 2) • Raster data analysis • Basic (lab 3) • Watershed delineation (lab 4) • Geostatistic analysis (6,7,8) • Lab5,6 • 3-D analysis (10,11,12) • Lab7,8 • Geoprocessing (13,14,15) • Lab9,10
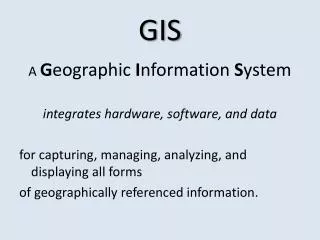
What is GIS ? • A computer system for • - collecting, • - storing, • - manipulating, • - analyzing, • - displaying, and • - querying geographically related information.
In general GIS cover 3 components • Computer system • Hardware • Computer, plotter, printer, digitizer • Software and appropriate procedures • Spatially referenced or geographic data • People to carry out various management and analysis tasks
Geographic Data • Geospatial data tells you where it is and attribute data tells you what it is. Metadata describes both geospatial and attribute data. In GIS, we call geographic data as GIS data or spatial data
Traditional method • To represent the geographic data is paper-based maps • Geology map • Topographic map • City street map (we still use it a lot) • ...
Characteristics of spatial data • “mappable” characteristics: • Location (coordinate system, will be lectured later) • Size is calculated by the amount (length, area, perimeter) of the data • Shape is defined as shape (point, line, area) of the feature • Discrete or continuous • Spatial relationships
Discrete and continuous • Discrete data are distinct features that have definite boundaries and identities • A district, houses, towns, agricultural fields, rivers, highways, … • Continuous data has no define borders or distinctive values, instead, a transition from one value to another • Temperature, precipitation, elevation, ...
GIS: a simplified view of the real world • Points • Lines • Areas • Networks • A series of interconnecting lines • Road network • River network • Sewage network • Surfaces • Elevation surface • Temperature surface Discrete features Continuous features
Problems caused by the simplified features may still exist, but let’s live on it • Dynamic nature (not static) • Forest grow • River channel change • City expand or decline • Identification of discrete and continuous features • Road to be a line or a area? • Scale • Some may not fit to any type of features: fuzzy boundaries • Transition area between woodland and grassland Lets do not worry about these problems now!!! Just keep in mind
Points • A point is a 0 dimensional object and has only the property of location (x,y) • Points can be used to Model features such as a well, building, power, pole, sample location ect. • Other name for a point are vertex, node Point
Lines • A line is a one-dimensional object that has the property of length • Lines can be used to represent road, streams, faults, dikes, maker beds, boundary, contacts etc. • Lines are also called an edge, link, chain, arc • In an ArcInfo coverage an arc starts with a node, has zero or more vertices, and ends with a node Line
Areas (Polygons) • A polygon is a two-dimensional object with properties of area and perimeter • A polygon can represent a city, geologic formation, dike, lake, river, ect. • Other name for polygons face, zone Area
Topology needed • A collection of numeric data which clearly describes adjacency, containment (coincidence), and connectivity between map features and which can be stored and manipulated by a computer. • A set of rules on how objects relate to each other • Major difference in file formats • Higher level objects have special topology rules
How Topology Works Node • We previously discussed that lines represent linear features, or borders for area features. We also said that every line starts and ends with a node, and has intermittent shape points called vertices to define the shape of the line or border. • So when you think about it, lines don’t really exist. They simply represent a relationship between two nodes and zero or more vertices. • When two lines cross, and form an intersection, they also have a node, since the intersection is the start of one line and the end of the other line. • Topology describes the connectivity of the lines and nodes. So for our example on the right, lines A and B are connected by node b. So line A goes from node a to node b. Line B goes from node b to node c. • Now, we can create a whole string of lines and put them together into an area too. Now, just like a line, polygons don’t really exist. They simply represent the relationship among lines, which in turn represent the relationship among points. c Line B b A a Polygon ©Arthur J. Lembo Cornell University
How Topology Works • Now we have described our location (with x,y coordinates), and our connectivity. What if we had two polygons P1 and P2, could we define the adjacency? Yes, here is how: • Line 1 goes from node a to node b. • Line 2 goes from node a to node b. • Line 3 goes from node b to node a. • Polygon P1 is to the left of line 2, and to the right of line 1. • Polygon P2 is to the right of line 2, and to the right of line 3. • So, we can create a table that “clearly describes location, adjacency, connectivity and containment, or more specifically, a topology table. 1 b P1 a 2 P2 3 Polygon Lines P1 1,2 P2 2,3 • Line FromNode ToNode LeftPolygon RightPolygon • a b 0 P1 • a b P1 P2 • 3 b a 0 P2 ©Arthur J. Lembo Cornell University
1 Traversing Topology b P1 a 2 P2 3 • Without looking at the picture, you can answer these questions from the table: • Where is node a. • No problem. It has an x,y coordinate • What polygon is P1 next to, and where are they adjacent: • P1 is next to P2 because Line 2 has polygon P1 to the left and P2 to the right. This is adjacency. • How do I traverse from node b, to node a, and then back to node b: • Easy! Take line 3 to node a, and you have a choice to take either line 2 or 3 back to node b. This is connectivity. • What lines does polygon P1 fall inside of: • Easy! Polygon P1 is contained by lines 1 and 2. This is containment Polygon Lines P1 1,2 P2 2,3 • Line FromNode ToNode LeftPolygon RightPolygon • a b 0 P1 • a b P1 P2 • 3 b a 0 P2 ©Arthur J. Lembo Cornell University
Topology © Paul Bolstad, GIS Fundamentals
Two basic data models to represent these features • Raster spatial data model • Define space as an array of equally sized cells arranged in rows and columns. Each cell contains an attribute value and location coordinates • Individual cells as building blocks for creating images of point, line, area, network and surface • Continuous raster • Numeric values range smoothly from one location to another, for example, DEM, temperature, remote sensing images, etc. • Discrete raster • Relative few possible values to repeat themselves in adjacent cells, for example, land use, soil types, etc. • Vector spatial data model • Use x-, y- coordinates to represent point, line, area, network, surface • Point as a single coordinate pair, line and polygon as ordered lists of vertices, while attributes are associated with each features • Usually are discrete features
DIGITAL SPATIAL DATA • RASTER • VECTOR • Real World Source: Defense Mapping School National Imagery and Mapping Agency
Raster and Vector Data Models Real World 600 1 2 3 4 5 6 7 8 9 10 G 1 B Trees 500 2 G B G 3 B 400 G G 4 B Trees Y-AXIS 5 B G G 300 B BK 6 G G House 7 B 200 B B 8 River 100 9 B 200 500 100 300 600 400 10 B X-AXIS Raster Representation Vector Representation Source: Defense Mapping School National Imagery and Mapping Agency
Example: continuous raster Xie et al. 2005
Raster Real world Vector Heywood et al. 2006
Effects of changing resolution Heywood et al. 2006
Vector – Advantages and Disadvantages • Advantages • Good representation of reality • Compact data structure • Topology can be described in a network • Accurate graphics • Disadvantages • Complex data structures • Simulation may be difficult • Some spatial analysis is difficult or impossible to perform
Raster – Advantages and Disadvantages • Advantages • Simple data structure • Easy overlay • Various kinds of spatial analysis • Uniform size and shape • Cheaper technology • Disadvantages • Large amount of data • Less “pretty” • Projection transformation is difficult • Different scales between layers can be a nightmare • May lose information due to generalization
GIS data formats (files) • Shapefiles • Coverages • TIN (e.g. elevation can be stored as TIN) • Triangulated Irregular Network • Grid (e.g. elevation can be stored as Grid) • Image (e.g. elevation can be stored as image, all remote sensing images) Vector data Raster data
Shape Files • Nontopological • Advantages no overhead to process topology • Disadvantages polygons are double digitized, no topologic data checking • At least 3 files .shp .shx .dbf
Coverages • Original ArcInfo Format • Directory With Several Files • Database Files are stored in the Info Directory • Uses Arc Node Topology • Containment (coincident) • Connectivity • Adjacency
TIN ©Arthur J. Lembo Cornell University • A triangulated irregular network (TIN) is a data model that is used to represent three dimensional objects. In this case, x,y, and z values represent points. Using methods of computational geometry, the points are connected into what is called a triangulation, forming a network of triangles. The lines of the triangles are called edges, and the interior area is called a face, or facet. • While the TIN model is somewhat more complex than the simple point, line, and polygon vector model, or the raster model, it is actually quite useful for representing elevations. For example a raster grid would require grid cells to cover the entire surface of a geographic area. Also, if we wanted to show great detail we would have to have small grid cells. Now, if the land area is relatively flat, we would still need the small grid cells. However, with a TIN we would not have to include so many points on the flat areas, but could add more points on the steep areas where we want to show greater detail. • The illustration shows how we can create a TIN of the terrain around Ithaca, NY. • First, a series of elevation points are created • Second, a TIN face is created with the elevation data • Third, the faces are shaded in to give the impression of a 3D surface
Components of a TIN • Nodes • Edges • Triangles • Hull • Topology ©Arthur J. Lembo Cornell University
Grid Properties • Each Grid Cell holds one value even if it is empty. • A cell can hold an index standing for an attribute. • Cell resolution is given as its size on the ground. • Point and Lines move to the center of the cell. • Minimum line width is one cell. • Rasters are easy to read and write, and easy to draw on the screen.
A new data model in ArcGIS • Geodatabase data model • Use a relational database that stores geographic data • A type of database in which the data is organized across several tables. Tables are associated with each other through common fields. Data items can be recombined from different files. • A container for storing spatial and attribute data and the relationships that exist among them • And their associated attributes can be structured to work together as an integrated system using rules, relationships, and topological associations
Geodatabase components-vector data and table • Primary (basic) components - feature classes, - feature datasets, - nonspatial tables. • complex components building on the basic components: - topology, - relationship classes, - geometric networks
Geodatabase components-Raster data • Raster data referenced only in personal geodatabase • Raster data physically stored in multiuser geodatabse • Raster datasets and raster catalogs • A raster dataset is created from one or more individual rasters. When creating a raster dataset from multiple rasters, the data is mosaicked, or aggregated, into a single, seamless dataset in which areas of overlap have been removed. The input rasters must be contiguous (adjacent) and have the same properties, including the same coordinate system, cell size, and data format. For each raster dataset (.img, grid, JPEG, MrSID, TIFF), ArcGIS creates an ERDAS IMAGINE file (.img). • A raster catalog is defined as a table in the geodatabase which you can view like any other table in ArcCatalog. Each raster in the catalog is represented by a row in the table. It contains a collection of rasters that can be noncontiguous, stored in different formats, and have other different properties. In order to view all the rasters in the catalog, they must have the same coordinate system and a common geographic extent
Attribute data • Attribute data is about “what” of a spatial data and is a list or table of data arranged as rows and columns • Rows are records (map features) • Each row represents a map feature, which has a unique label ID or object ID • Columns are fields (characteristics) • Intersection of a column and a row shows the values of attributes, such as color, ownership, magnitude, classification,…
Data types of attribute data: character, integer, floating, date • Each field must be defined with a data type, data width, number of decimal places • The width refers to the number of space reserved for a field
A database needed • If many fields related to one record (feature-ID), for example, the a soil unit can have over 80 estimated physical and chemical properties, more tables are needed to store all the attributes. • A database management system (DBMS) is needed to manage multiple tables. • A database is a collection of interrelated tables in digital format. There are four types: • Flat file, hierarchical database, network database, relational database • In GIS, we usually use relational database
Hierarchical Flat file Relational Network PIN: Parcel ID number Zoning (zonecode): 1-residential, 2-commercial Chang, 2004
Relational database • A relational database is a collection of tables, also called relations, which can be connected to each other by keys. • A primary key represents one or more attributes whose values can uniquely identify a record in a table. Its counterpart in another table for the purpose of linkage is called a foreign key • Advantages • Each table in the database can be prepared, maintained, and edited separately from other tables • Efficient data management and processing, since linking tables query and/or analysis is often temporary
Three tables linked by keys Students: Registration: Faculty:
Four tables linked by keys Chang, 2004
Relationship of those separate tables One record in one table related to one record in another table One record in one table related to many records in another table Many records in one table related to one record in another table Many records in one table related to many records in another table
Join and relate tables • Once tables are separated as relational tables, then two operations can be used to link those tables during query and analysis • Join, brings together two tables based on a common key. • Relate, connects two tables (based on keys) but keeps the tables separate. • Keys do not have to have the same name but must be of the same data type Join relate Join relate