Workplace Fatalities in Indiana: 2008 Statistics and Trends
160 likes | 212 Vues
Explore the detailed data on workplace fatalities in Indiana in 2008, analyzing trends by industry, events, and worker characteristics. Discover key insights and comparisons with national statistics.

Workplace Fatalities in Indiana: 2008 Statistics and Trends
E N D
Presentation Transcript
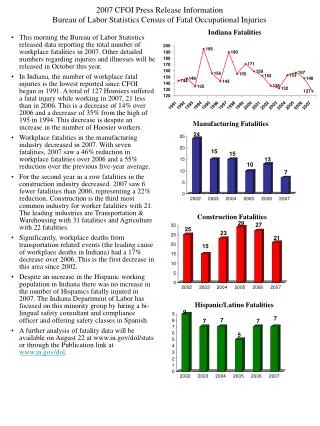
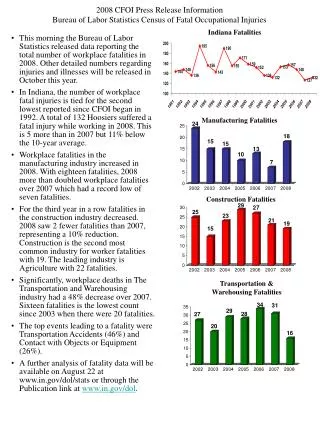
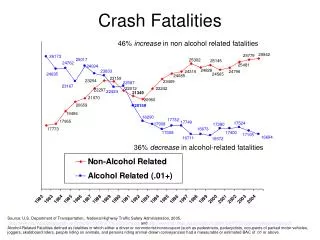
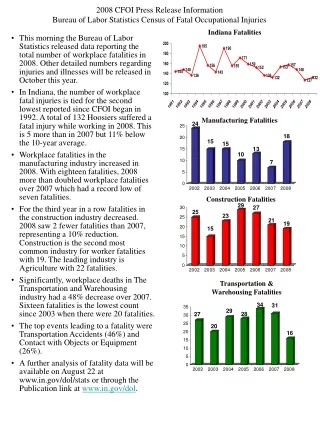
2008 CFOI Press Release InformationBureau of Labor Statistics Census of Fatal Occupational Injuries Indiana Fatalities • This morning the Bureau of Labor Statistics released data reporting the total number of workplace fatalities in 2008. Other detailed numbers regarding injuries and illnesses will be released in October this year. • In Indiana, the number of workplace fatal injuries is tied for the second lowest reported since CFOI began in 1992. A total of 132 Hoosiers suffered a fatal injury while working in 2008. This is 5 more than in 2007 but 11% below the 10-year average. • Workplace fatalities in the manufacturing industry increased in 2008. With eighteen fatalities, 2008 more than doubled workplace fatalities over 2007 which had a record low of seven fatalities. • For the third year in a row fatalities in the construction industry decreased. 2008 saw 2 fewer fatalities than 2007, representing a 10% reduction. Construction is the second most common industry for worker fatalities with 19. The leading industry is Agriculture with 22 fatalities. • Significantly, workplace deaths in The Transportation and Warehousing industry had a 48% decrease over 2007. Sixteen fatalities is the lowest count since 2003 when there were 20 fatalities. • The top events leading to a fatality were Transportation Accidents (46%) and Contact with Objects or Equipment (26%). • A further analysis of fatality data will be available on August 22 at www.in.gov/dol/stats or through the Publication link at www.in.gov/dol. Manufacturing Fatalities Construction Fatalities Transportation & Warehousing Fatalities
CFOI Highlights • 132 Fatal Injuries. • Top industries: • Agriculture (22) • Construction (19) • Manufacturing (18) • Top three events • Transportation Incidents (61) • Contact with Objects (34) • Assaults and Violent Acts (12) • Falls (12) • Significant Industry decreases • Transportation & Warehousing: 31 in 2007 to 16 in 2008 - 48% decrease • Construction: 21 in 2006 19 in 2008 - 10% decrease • 2007 Worker characteristics • 92% men 8% women • 89% white 8% latino/hispanic 7% black • Most common age bracket is 45-54 year olds with 28% • 22% of workers were self-employed National Comparison • US fatalities decreased 10% from 2007 to 2008 (from 5,488 in 2007 to 5,071 in 2007). Indiana fatalities increased 4% (127 to 132). Thirteen other states had an increase in their number of fatalities. • Construction is the #1 Industry with fatalities in the US. In Indiana the industry with the most fatalities is Agriculture. • In 2007 Indiana was #14 for the raw number of fatalities by state. (Texas is #1 with 457 fatalities and the low was Rhode Island with 6). Rates by state are unavailable. States with 100+ fatalities
Agriculture Industry Sub-Industry Fatalities Fatal Events 18-year Trend • By occupation there are 17 farmers (farm managers) and 4 Agriculture workers • 21 were self-employed • Tractors were the primary source for injury in 11 fatality cases
Construction Industry Sub-Industry Fatalities Fatal Events 17-year Trend • In the past 10 years Construction has averaged 24 fatalities per year. 2008 is 21% below this average. • The most recent high fatality count for construction was 32 in the year 2000.
Manufacturing Industry Sub-Industry Fatalities Fatal Events 17-year Trend
Other Industry Trends Indiana Total Transportation & Warehousing Retail Trade
Other Industry Trends State & Local Government Professional & Business Services No corresponding data prior to 2003. when BLS switched from SIC to NAICs for industry coding Leisure & Hospitality No corresponding data prior to 2003. when BLS switched from SIC to NAICs for industry coding
Transportation Events Industries 17-year Trend *American Eagle Commuter Flight 4184 Crash, October 31, 1994, Newton County
Contact with Objects Industries 17-year Trend
Falls Industries 17-year Trend
Assaults & Violent Acts Industries 16-year Trend
Other Event Trends Exposure to harmful substances or environments Electrocution (Subset of Exposure) Fires & Explosions
Worker Characteristics Gender Age Race Employee Status
Worker Characteristic Trends Women Hispanic/Latino Black, non-hispanic