Crash Fatalities
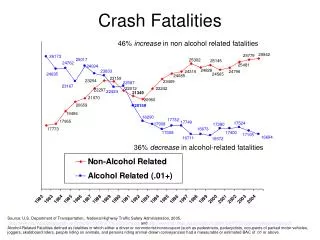
Crash Fatalities. 46% increase in non alcohol related fatalities. 36% decrease in alcohol-related fatalities. Source: U.S. Department of Transportation, National Highway Traffic Safety Administration, 2005.

Crash Fatalities
E N D
Presentation Transcript
Crash Fatalities 46% increase in non alcohol related fatalities 36% decrease in alcohol-related fatalities Source: U.S. Department of Transportation, National Highway Traffic Safety Administration, 2005. http://www-nrd.nhtsa.dot.gov/pdf/nrd-30/NCSA/TSFAnn/TSF2003Final.pdf and http://www-nrd.nhtsa.dot.gov/pdf/nrd-30/NCSA/PPT/2004AnnualAssessment.pdf Alcohol-Related Fatalities defined as fatalities in which either a driver or nonmotorist/nonoccupant (such as pedestrians, pedacyclists, occupants of parked motor vehicles, joggers, skateboard riders, people riding on animals, and persons riding animal-drawn conveyances) had a measurable or estimated BAC of .01 or above.
Crash Fatalities Source: U.S. Department of Transportation, National Highway Traffic Safety Administration, 2005. http://www-nrd.nhtsa.dot.gov/pdf/nrd-30/NCSA/TSFAnn/TSF2003Final.pdf and http://www-nrd.nhtsa.dot.gov/pdf/nrd-30/NCSA/PPT/2004AnnualAssessment.pdf Alcohol-Related Fatalities defined as fatalities in which either a driver or nonmotorist/nonoccupant (such as pedestrians, pedacyclists, occupants of parked motor vehicles, joggers, skateboard riders, people riding on animals, and persons riding animal-drawn conveyances) had a measurable or estimated BAC of .01 or above.
Crash Fatalities Source: U.S. Department of Transportation, National Highway Traffic Safety Administration, 2005. http://www-nrd.nhtsa.dot.gov/pdf/nrd-30/NCSA/TSFAnn/TSF2003Final.pdf and http://www-nrd.nhtsa.dot.gov/pdf/nrd-30/NCSA/PPT/2004AnnualAssessment.pdf Alcohol-Related Fatalities defined as fatalities in which either a driver or nonmotorist/nonoccupant (such as pedestrians, pedacyclists, occupants of parked motor vehicles, joggers, skateboard riders, people riding on animals, and persons riding animal-drawn conveyances) had a measurable or estimated BAC of .01 or above.
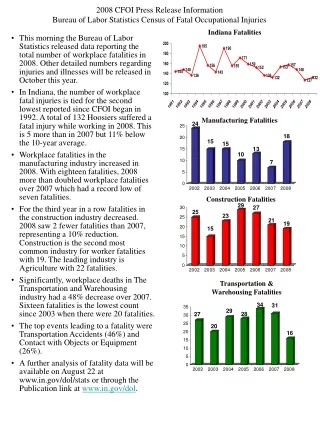
Crash Fatalities InvolvingA 16-20 Year Old Driver 17% increase in non alcohol-related fatalities involving a teen driver 62% decrease in alcohol-related fatalities involving a teen driver Source: U.S. Department of Transportation, National Highway Traffic Safety Administration, 2005. Persons killed in motor vehicle traffic crashes involving a 16-20 year old driver by the highest 16-20 year old driver BAC in the crash.
Crash Fatalities InvolvingA 16-20 Year Old Driver Source: U.S. Department of Transportation, National Highway Traffic Safety Administration, 2005. Persons killed in motor vehicle traffic crashes involving a 16-20 year old driver by the highest 16-20 year old driver BAC in the crash.