Download
1 / 1
10 likes | 137 Vues
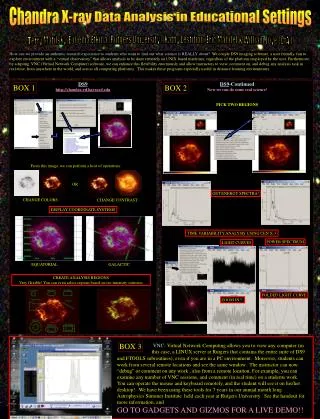
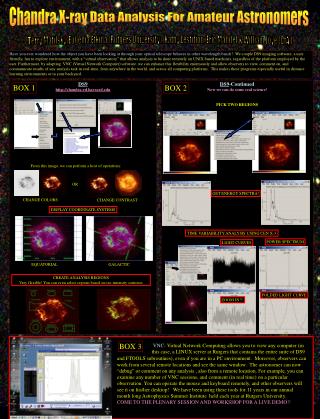
Chandra X-ray Data Analysis For Amateur Astronomers. Terry Matilsky, Eugenia Etkina (Rutgers University), Kathy Lestition, Eric Mandel & William Joye (CfA).

E N D
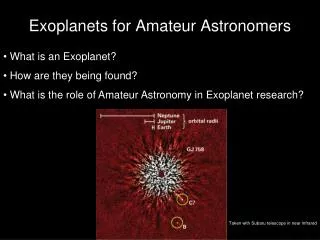
Chandra X-ray Data Analysis For Amateur Astronomers Terry Matilsky, Eugenia Etkina (Rutgers University), Kathy Lestition, Eric Mandel & William Joye (CfA) Have you ever wondered how the object you have been looking at through your optical telescope behaves in other wavelength bands? We couple DS9 imaging software, a user friendly, fun to explore environment, with a “virtual observatory” that allows analysis to be done remotely on UNIX based machines, regardless of the platform employed by the user. Furthermore, by adapting VNC (Virtual Network Computer) software, we can enhance this flexibility enormously and allow observers to view, comment on, and communicate results of any analysis task in real-time, from anywhere in the world, and across all computing platforms. This makes these programs especially useful in distance learning environments or in your backyard. DS9 http://chandra-ed.harvard.edu DS9-Continued Now we can do some real science! PICK TWO REGIONS BOX 1 BOX 2 DS9 From this image, we can perform a host of operations: OR GET ENERGY SPECTRA! CHANGE COLORS CHANGE CONTRAST DISPLAY COORDINATE SYSTEMS TIME VARIABILITY ANALYSIS USING CEN X-3 POWER SPECTRUM LIGHT CURVES EQUATORIAL GALACTIC CREATE ANALYSIS REGIONS Very flexible! You can even select regions based on iso-intensity contours FOLDED LIGHT CURVE ZOOM IN!!! BOX 3 VNC- Virtual Network Computing allows you to view any computer (in this case, a LINUX server at Rutgers that contains the entire suite of DS9 and FTOOLS subroutines), even if you are in a PC environment. Moreover, observers can work from several remote locations and see the same window. The astronomer can now “debug” or comment on any analysis , also from a remote location. For example, you can examine any number of VNC sessions, and comment (in real time) on a particular observation. You can operate the mouse and keyboard remotely, and other observers will see it on his/her desktop! We have been using these tools for 11 years in our annual month long Astrophysics Summer Institute held each year at Rutgers University. COME TO THE PLENARY SESSION AND WORKSHOP FOR A LIVE DEMO!!