Download
1 / 41
710 likes | 2.67k Vues
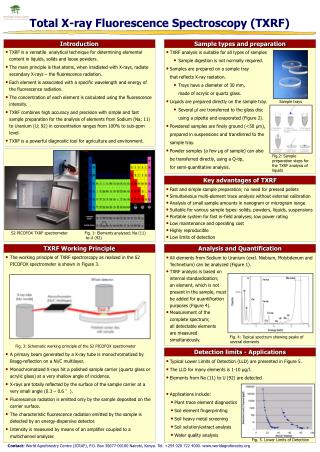
X-ray Fluorescence Analysis. A.Somogyi (ESRF) A.Iida (KEK-PF) K.Sakurai (NIMS, Tsukuba) T. Ohta (U.Tokyo). What happens by core hole creation?. K. K. L. L. M. M. Auger electron emission. X-ray Fluorescence. How can we create core holes?.

E N D
X-ray Fluorescence Analysis A.Somogyi (ESRF) A.Iida (KEK-PF) K.Sakurai (NIMS, Tsukuba) T. Ohta (U.Tokyo)
What happens by core hole creation? K K L L M M Auger electron emission X-ray Fluorescence
How can we create core holes? • X-rays, Electrons, Ions which have higher energy than the core electron ionization energies. • Electrons and ions produces many peaks with multiple excitations. X-ray excitation is preferable. • Now, X-ray fluorescence analysis by X-ray excitation is a standard technique for trace element alalysis.
How is the Trace Characterization important? Industrial Bio-medical ? LSI Environmental Social ? ?
Why synchrotron radiation x-rays ? • Higher intensity higher sensitivity • Energy tunability Make the analysis easier, chemical state analysis • Polarizablity Reduce background • Directionality applicable to tiny sample • Spectromicroscopy, Imaging
Synchrotron Radiation excited X-ray fluorescence Analysis Advantages of XRF elemental analysis SR • High sensitivity • ng=>fg, ppm=>ppb • Chemical state analysis • Micro-beam analysis • mm=> mm • Total reflection analysis • 1015atoms/cm2=>108atoms/cm2
Total-refection X-Ray Fluorescence ( TXRF ) Reduction of scattering background from the substrate(1) Critical Angle Si ( Li ) Detector Sample
Total-refection X-Ray Fluorescence ( TXRF ) Reduction of scattering background from the substrate (2) SR (horizontally polarized beam) Fluorescent X-rays IS IF Detector r Scattered X-rays R
Comparison of S/N and S/B ratios Monochromatic excitation Laboratory source Continuum excitation Refl./Trans. Mirrors Sample: chelete resin beads
How to analyze X-Ray Fluorescence Wavelength-dispersive vs. energy-dispersive Wavelength-dispersive Energy-dispersive electronic signal processing 2dsinq=l Energy crystal MCA solar-slit solar-slit semiconductor/ superconductor detector gas/scintillation detector Energy
Chemical Characterization by X-ray Fluorescence Spectra Si ( Li ) detector • Qualitative and quantitative analysis • in terms of XRF • Intensity changes • Chemical shifts • Profile changes and other fine structures • Satellite lines Single-crystal spectrometer Double-crystal spectrometer
Chemical Shifts and Profile Changes High resolution X-ray spectrometry KMnO4 K2MnO4 Mn green MnO2 Mn2O3 MnO 0.2 Intensity ( normal ised ) 0.1 0 0 10 20 30 40 50 Energy ( eV ) ( + 5860 eV ) MnKa1 MnKa2 Prof. Y. Gohshi
Selectively Induced X-Ray Emission Using Edge Shifts Use of tunable monochromatic synchrotron source EL EH Fe2O3 FeO K.Sakurai ~1988
Synchrotron X-Ray Microbeam side view Kirkpatrick-Baez Optics top view sample Slit 1 Slit 2 SR sample IC IC Double crystal monochromator Multilayer monochromator Beam size 5~6 mm2 (1 mm min) Photon Flux(Max) 1010 (Multilayer) 108 (DXM)
Application to criminology • A serious case of murder happened in a small town in Japan in 1999. • White arsenic(arsenic oxide) was mixed in curry and 5 kids died of arsenic poisoning. • No wittness and no confession, only presumptive evidence • XFS technique works effectively.
XFS of white arsenic produced in various countries As Bi Ag Sb Sb Korea China Spectral patterns from two samples agree with each other! Mexico X-ray energy(keV)
Plan View of Beamline 40XU at SPring-8 N N S S (Distance from the source) 55m 50m 45m 40m 35m Experimental hutch Optics hutch HALL K-B mirrors SR Spectrometer RING ID Gap 12mm Helical Undulator
From Energy-dispersive to Wavelength-dispersive Spectrometer To further upgrade signal to background ratio Energy-dispersive TXRF Wavelength-dispersive TXRF Si(Li) Detector Scintillator detector Analyzing Crystal (Johansson) X-ray Sample X-ray Sample Substrate Substrate Advantages Large solid angle (High detection efficiency) Collecting whole XRF spectra simultaneously Advantages High energy-resolution Good signal to background ratio Disadvantages Low energy-resolution Limitation of counting-rate Scattering background Disadvantages Low detection-efficiency
Design Considerations Flexibility and feasibility for practical analytical applications SR Curved Crystal Johansson Ge (220) Entrance Slit Receiving Slit Detector Sample Vac. chamber Rowland Circle R=120mm ( flexible ) 4 axes for scanning X-ray energy 4 axes for alignment and positioning of the sample
Compact Johansson X-ray Fluorescence Spectrometer He gas Ionization chamber Crystal analyzer Ge (220) Johansson SR Detector Vac. chamber Sample Sample positioning stages
Performance of the Spectrometer Feasibility for the analysis of trace elements in small samples Coal Fly Ash (NIST SRM-2690) Lily Pollen (20 particles.) 100mm (300 ppm) 35mm Glass Capirally Capillary Powders adhered to glue sphere (~0.5mm) FWHM 7.2eV (5800 ppm) (67 ppm)
WD-TXRF Spectra for Trace Elements in Micro Drop Significant enhancement of signal to background ratio Sample Fe, Ni, Co 20ppb 0.1ml X-ray Substrate 5 sec/point FWHM 7.06eV FWHM 6.62eV FWHM 5.71eV
Performance of Wavelength-Dispersive TXRF ppt level detection limit with less than 10eV energy Ni 1ppb-0.1ml liquid drop Calibration curve 13536counts /20sec FWHM 7eV Detection Limit 196counts /20sec Concentration of solution of 0.1ml Absolute amount 0.31fg 3.1ppt Ni Ni in 0.1 ml solution
Summary Towards ppt chemistry Reducing scattering background as well as parasitic X-rays due to contamination is extremely important. 10-3 Downsized wavelength depressive XRF spectrometer is effective to enhance both detection efficiency and energy resolution. Present detection limit (SR-WD TXRF) 10-6 (ppm) ~10-16g ~10-12(ppt) For 0.1ml 10-9 (ppb) 10-12 (ppt) 10-15 (fg) 10-12 (pg) 10-9 (ng) 10-6 (g) Trace chemical characterization using Kb spectra Conventional XRF Concentration ( g/g ) AAS Conventional TXRF ICP-MS Absolute amount ( g )
Conclusions SR-X-ray XRF technique is very powerful. • Low detection limit down to fg, ppt level • applicable to samples of limited size • well analyzed due to energy tunability and high energy resolution • Development of XRF imaging • Combination with different micro techniques (XRD, XANES and EXAFS)