Download
1 / 19
190 likes | 243 Vues
Dive into assessing the mineral and economic potential of polymetallic nodule deposits in theCook Islands Exclusive Economic Zone using sophisticated GIS technology. Explore the extensive history of seabed mineral exploration in the area and its impact on the local economy and environment. Learn about the Cook Islands' unique geographical features, economic data, and the collaborative efforts between the Cook Islands Seabed Minerals Authority and Kenex Ltd in harnessing the potential of deep-sea mining.

E N D
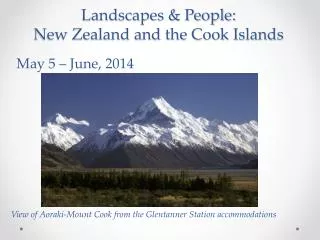
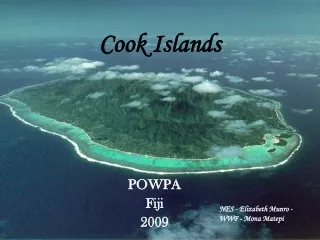
POLYMETALLIC NODULE DEPOSITSin the COOK ISLANDS EEZ Using GIS to better assess the mineral and economic potential for polymetallic nodule deposits in the Cook Island Exclusive Economic Zone Elisa Puccioni Senior GIS Analyst at Kenex Ltd
The EEZ North Penrhyn Basin Seabed mineral exploration within the EEZ began in the 1960s. The 1970s surveys resulted in the discovery of significant MN resources. Surveys from 1985 to 2000s by the Japan-SOPAC delivered a range of data and models including a systematic survey of much of the EEZ. The Cook Island Exclusive Economic Zone spread over 2 million of km2. The total cumulative land area of the Cook Islands is 237 km2 giving it an ocean/land area of c. 8440:1 This makes it a large Ocean Island State as well as a Pacific Small Island Developing State (PSIDS). South Penrhyn Basin Aitutaki Passage Samoan Basin The complex morphology of the EEZ includes seamounts, abyssal hills, abyssal plains, atolls, troughs, and a major plateau. Southwest Pacific Basin
Cook Island GDP % and Income (2017) SeabedMineral Exploration $50,000+ 1% + Deeper knowledge of the ocean’s resources Environmental impact to be quantified - - - - No Income 13% + Improve the Cook Islands’quality of life Possible impact on Tourism and Fishery 0-$10,000 51% $10,000 - $25,000 28% $25,000 - $50,000 7% + + + Cultural belief New job positions and upskilling Cook Islanders + More investment in services and education Logistics for processing and transportation
Cook Island GDP % and Income (2017) Seabed Mining Exploration ? $50,000+ 1% + Environmental Impact Deeper Knowledge of the ocean’s resources - - - - No Income 13% + Increment in life quality Tourism and Fisheries Impact 0-$10,000 51% $10,000 - $25,000 28% $25,000 - $50,000 7% - + + + Cultural Issues New job positions and funding - + Logistic and infrastructure issues More investment in infrastructure and services -
TIME LINE Cook Islands Seabed Minerals Authority & Kenex collaboration 2009 2012 2017 2018 2019 2013 2015 2016 SBMA 2009: the world first Seabed Act is created by the CI government 2012: the SBMA is established KENEX First projects with SMBA: GIS database from historic cruise dataFirst geological potential model in the EEZ SBMA CI Prospecting and Exploration Regulations; the Seabed Minerals Amendment Act First official tender for exploration KENEX Probabilistic evaluation of the EEZ seabed mineral acreage and economic value KENEX/SBMA Enterprise GIS database for managing applications and licenses SBMA2017: SBMA become part of the Marae Moana project KENEX/SBMA 2018: new GIS enterprise infrastructure and new areas for tender based on GIS models The new official tender opens
TIME LINE Cook Islands Seabed Minerals Authority & Kenex collaboration 2009 2012 2017 2018 2019 2013 2015 2016 SBMA 2009: the world first Seabed Act is created by the CI government 2012: the SBMA is established KENEX First projects with SMBA: GIS database from historic cruise dataFirst geological potential model in the EEZ SBMA CI Prospecting and Exploration Regulations; the Seabed Minerals Amendment Act First official tender for exploration KENEX Probabilistic evaluation of the EEZ seabed mineral acreage and economic value KENEX/SBMA Enterprise GIS database for managing applications and licenses SBMA2017: SBMA become part of the Marae Moana project KENEX/SBMA 2018: new GIS enterprise infrastructure and new areas for tender based on GIS models The new official tender opens
Cruises: 1974 - Tangaroa ORSTOM, Nomea – 1977 – R.V. Coriolis ORSTOM, Noumea – 1978 – R.V. Sonne CCOP/SOPAC – 1976-1981 Geological Society of Japan (JICA) – 1980 – Hakurei-Maru No. 2 JICA – 1983 – Hakurei_Maru GH83 JICA/SOPAC – 1985 & 1986 – Hakurei-Maru No. 2 Australian and New Zealand Governments – 1986 1987 – Thomas Washington Cruise JICA/SOPAC – 1990 – Hakurei-Maru No. 2 1997 - HMNZS Tui Cruise JICA – 2000 - Hakurei-Maru No. 2 Digital + Paper Data > 60 reports to check! The historic GIS database (HENS)
40 shapefiles with locations, abundance and metal % data + 1,000 linked pictures The historic GIS database (HENS)
Rigorous mineral systems approach Training and Evidence data availability What is a geological potential model? GIS geostatistical model tools Data Driven or Expert Based models Target areas with the highest potential (known and new!)
DEPOSIT MODEL Nodule morphology and formation FIVE BROAD CATEGORIES Hydrogenetic Diagenetic Hydrothermal Halmyrolitic Biogenetic TWO GENERAL CLASSES Smooth surface texture (related to hydrogenetic) Intermediate to rough surface texture
DEPOSIT MODEL Local morphology and conditions CONDITIONS Depth > 4,000m Siliceous/pelagic sediment (no calcareous) Below Carbonate Compensation Depth Low rate of sedimentation Deep steady currents LOCAL MORPHOLOGY Large variations in bathymetry Two major ocean currents: - Antartic Bottom Water - Southern Equatorial Nodule abundances vary greatly from North to South
Geological potential model setting WEIGHTS OF EVIDENCE MODEL Data-driven model. Prior probability value: 0.0001449 01 STUDY AREA The extent rectangle of the EEZ (~ 4.000.000 km2) 02 TRAINING POINTS 57 known deposits from the HENS DB with Mn Nodule Abundance > 30 kg/m2 03
Step by Step Features tested: Geology Volcanic features Seafloor slope Bathymetry Carbonate compensation depth Sedimentation Geochemistry ADEPOSIT MODEL for polymetallic nodules is defined based on the mineral system (Wyborn et al. 1995) All available data relating to the nodule deposit model in the EEZ is compiled SOURCE OF METALS Volcanoes Lithology FORMATION AND TRAP Seafloor Depth Seafloor Slope DEPOSITION AND PRESERVATION Sediment Thickness CCD Mn/Fe Ratio
Step by Step Spatial correlated variables: Lower Cretaceous Geology <50 km distance from seamounts Low seafloor slope (0.1 deg) < -4800m depth < 100m sediment thickness Below CCD Mn/Fe ration < 1.2 TheWeights of Evidence model is run to assess and weight the data based on the relationship to known locations of nodules The data are statistically combined to create a single Geological Potential Map showing the areas most likely to contain economic nodule deposits.
Study Area Above prior probability Very prospective Highly prospective TP in very prospective TP in highly prospective
Using the Results Geological Constrain for the Acreage Evaluation model (RESULTS ARE CONFIDENTIAL) GIS geostatistical tools to interpolate nodule coverage CONSTRAINED TO GEOLOGICAL SUITABLE AREAS Estimated tonnes/km2 of nodules Derived % and estimated tonnes/km2 of metals Calculated eventual value per metal (US$/tonne)
KNOWLEDGE EVALUATION PLANNING MARKETING INDUSTRY Identify potential areas of research focus for any future exploration activity to increment the knowledge of the ocean and its resources. Evaluate meaningfully the exploration acreage and possible nodule coverage through using probability values to constrain estimations. Prepare and select acreage for tender, determining areas to be set aside for economic, strategic and/or environmental reasons. Both the HENS database and the modelling results are part of the tender package to promote investment in the CIEEZ. Sharing the results enables the industry to make an estimate of the geological potential of given locations and plan exploration programmes.
THANK YOU! Any questions?