Download
1 / 17
170 likes | 372 Vues
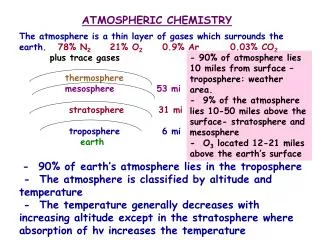
Introduction to Atmospheric Chemistry Measurements-I. John Ortega National Center for Atmospheric Research Boulder, CO, USA. National Center for Atmospheric Research Boulder, CO USA. United States National Science Foundation. Outline. Atmospheric structure (T, P)

E N D
Introduction to Atmospheric Chemistry Measurements-I John Ortega National Center for Atmospheric Research Boulder, CO, USA National Center for Atmospheric Research Boulder, CO USA United States National Science Foundation
Outline • Atmospheric structure (T, P) • Atmospheric composition (What’s in the air?) • Emissions (Where do things come from?) • Atmospheric lifetime (How long does it exist?) • Chemistry (How do things react?)
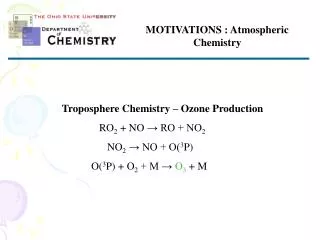
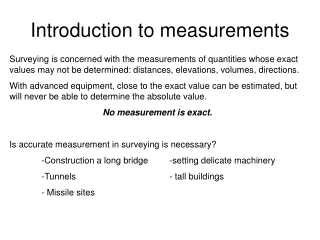
Structure • Ideal gas law: PV=nRT; n=PV/RT = 2.4 x 10¹⁹ molecules cm-3 at the surface • Pressure = weight of atmospheric column above a surface • ~101 kN/m2 or 1 kg/cm2 or 14.7 lb/in2 • Gamma (G) = atmospheric lapse rate = cooling rate with increased altitude in °C km-1 • Dry: 10 • Wet: 4 • Average: 6-8 • Free troposphere – layer of the atmosphere that is not affected by the surface and winds are geostrophic (parallel to isobars) • Boundary layer – layer below which is affected by the surface; affected by vertical motion due to radiative heating. • How does the boundary layer change with different times of day?
Planetary Boundary Layer Winds are geostrophic Parallel to isobars Surface (friction) influences , vertical motion due to radiative heating
Structure G = -g/Cp = -9.8 K/km (dry)
Which is which? Average Wet Dry
Composition: What’s in the air? This is what we concentrate on! CO2, CO, CH4, VOC, oVOC, NOx, SO2 Approximate lower tropospheric mixing ratios
Challenge: How to measure one compound among many? C6H6 SO2 CO2 CH4 NOx CH4 O3 SO2 CO CO CO NOx C5H8 CO2 CO2 CO NOx O3 CH4 SO2 SO2 CH4 CH4 CH4 SO2 NOx C5H8 NOx O3 CO C6H6 C6H6 O3 NOx NOx SO2 CH4 CH4 C5H8 SO2 O3 C5H8 NOx CH4 CH4 CO O3 CH4 C5H8 Specificity Interference Remote vs. Direct Derivitization Other practical issues C6H6 CO2 C5H8 CO CO CO2 O3
Non-refractory aerosol composition (PM1 or PM2.5 from AMS) Jimenez et al. 2009
Direct emissions relevant to Nigeria II CO VOC oVOC NOx PM (EC, POA) O3 SOA Data courtesy of C. Liousse and E. Assamoi.
Approximate budget of 2 compounds in Tg per year • CO CH4 D. Jacob: http://acmg.seas.harvard.edu/people/faculty/djj/book/bookchap11.html
Approximate atmospheric lifetimes 1 hr ~1 s
How are compounds removed from the atmosphere? Oxidation • NO3 • OH • O3
1 Chemistry Example – Leighton Cycle NO + O3 → NO2 + O2 NO2 + hn → NO + O O+O2+M → O3 --------------------------------- l < 420 nm
O3 is a non-linear function of NOx and VOCs VOC-limited ~100 ppb Ridge: Optimum O3 production Nitrogen Oxides (NOx) NOx-limited Volatile Organic Compounds (VOCs) ~ 1 ppm