Download
1 / 12
120 likes | 240 Vues
This instructional guide by Glasgow Mathematics explores the fundamental concepts of speed, distance, and time through distance-time graphs. It provides visual representations to help students recognize various types of motion, including fast, slow, and stopped scenarios. Each graph corresponds to specific situations, enabling learners to visualize how steepness relates to speed. Engage with exercises that reinforce these concepts and enhance your understanding of motion dynamics. Join us in mastering this essential topic in physics and mathematics!

E N D
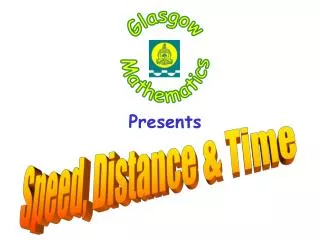
Glasgow Mathematics Presents Speed, Distance & Time
Distance – Time Graph Distance Time
Distance – Time Graph Click the picture below that matches graph A. Distance A Time
Distance – Time Graph Click the picture below that matches graph B. Distance B A Time
Distance – Time Graph Click the picture below that matches graph C. Distance C B A Time
Distance – Time Graph Click the picture below that matches graph D. D Distance C B A Time
Steeper means faster! Distance – Time Graph E Click the picture below that matches graph E. D Distance C B A Time
Distance – Time Graph Slower Stopped Distance Fast Time
50 40 30 20 10 0 1 2 Distance – Time Graph Distance (km) Time (hours)
Now do Exercise 1, Q. 1.
Smithycroft Mathematics K Hughes 2003