Download
1 / 34
340 likes | 480 Vues
Global Change, Eco-Apartheid and Population Health. William E. Rees, PhD University of BC GLOBAL CHANGE AND HEALTH: WHO ARE THE VULNERABLE? Ottawa, Ontario 5 November 2007. Population has quadrupled to 6.3 billion Energy use is up 16-fold Industrial production has grown 40-fold

E N D
Global Change, Eco-Apartheid and Population Health William E. Rees, PhDUniversity of BC GLOBAL CHANGE AND HEALTH: WHO ARE THE VULNERABLE? Ottawa, Ontario 5 November 2007
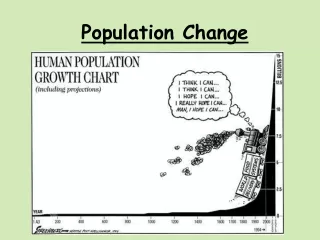
Population has quadrupled to 6.3 billion Energy use is up 16-fold Industrial production has grown 40-fold Water use has increased 9 times Fish catches higher by a factor of 35 Carbon Dioxide emissions are 17 times higher Sulphur emissions have increased 13-fold Other air pollutants are up by a factor of 5 Accelerating tropical deforestation and desertification Context: An Anomalous Period of Geometric Growth
Estimated Human Population over the Past Two Millennia (Cohen 1995) 2007 Population: 6.6 billion Continuous growth—population and economic—is an anomaly. The growth spurt that recent generations take to be normal is the single most abnormal period of human history.
Symptom: Atmospheric Carbon Dioxide: Up 30% in the past century • Pre-industrial concentration of GHGs: 280 ppm • Present concentration: 430 ppm (a 54% increase)
N. Hemisphere Temp. Reconstruction (blue);Instrumental Measurements (red)
Climate Change Summary(IPCC 2006 Consensus) • Atmospheric carbon dioxide, methane and other greenhouse gases are at the highest levels in at least 650,000 years. • It is very likely that greenhouse gas forcing has been the dominant cause of the observed global warming over the past 50 years. • Global average temperatures this century will rise by between 2C° (the target ‘allowable’ increase) and 4.5C°. • The increase could be enhanced a further 1.5C° as a result of “positive feedbacks.” • Some warming has been offset by cooling from other anthropogenic factors (suspended aerosols). (Without this effect, mean global temperatures would be even higher.)
Recent Conclusions (Oct 2007) • The Arctic’s floating sea ice is headed toward summer disintegration as early as 2013, a century ahead of the International Panel on Climate Change (IPCC) projections. • The rapid loss of Arctic sea ice will speed up the disintegration of the Greenland ice sheet and a rise in sea levels by even as much as 5 metres by the turn of this century is possible. • The Antarctic ice shelf also reacts far more sensitively to warming temperatures than previously believed.
Unprecedented Losses ofSea Ice In 2007 Such massive ecological changes in the circumpolar Arctic threaten wildlife—we may see the extirpation of polar bears from much of the North—and herald the permanent loss of the Inuit way of life. Diabetes and related health risks are clearly associated with replacement of ‘country food’ with store-bought junk food in Northerners’ diets.
IPCC Projections: Way Off Meltdown: A hundred years ahead of schedule?
Increasing greenhouse gases Global warming • - Melting permafrost • Release of gas • hydrates • - More forest fires Decreased albedo (more heat retention) Melting polar sea ice Multi-Layered Auto-Catalysis?(Potential for runaway positive feedback)
Recent Findings (Oct 2007), Part 2 • Temperatures are now within ≈1°C of the maximum temperature of the past million years. • It is now “very unlikely” (≤ 10%) that the world can avoid a potentially catastrophic mean global temperature increase of 2 C° • Carbon dioxide (CO2) emissions are now growing more rapidly than "business-as-usual", the most pessimistic of the IPCC scenarios. (Increases are 35% higher than expected since 2000.) • Long-term climate sensitivity may be double the IPCC standard (of 3C° for a doubling of atmospheric CO2)
Probable Impacts of a 3-4 Celsius Degree Increase in MGT (Stern Report) • Major declines in crop yields over entire regions. • Sea level rise threatening London, Shanghai, New York, Tokyo, Hong Kong, Cairo and areas inhabited by 5% of the world’s population (350,000,000 people). • Collapse of the Amazon rainforest. • Collapse of the Gulf Stream (European cooling) and irreversible climate feedbacks, e.g., methane release. • Loss of up to 40% of the world’s species. • Loss of the world’s major glaciers; shifting precipitation spreading deserts here, major flood risks there (or both). • Major health epidemics particularly among the poor and the displaced.
The Economic Driver: Our Ecological Footprints • The ‘ecological footprint’ of a specifiedpopulation is the area of land and water ecosystems required to produce the resources that the population consumes, and to assimilate the wastes that the population produces,wherever on Earth the relevant land/water may be located.
Eco-Footprints Vary with Income • The average per capita ecological footprints of residents of high-income countries range between four and ten hectares (10 to 25 acres). • The residents of the poorest countries survive on less than half a hectare.
Eco-Footprint (Gha/Capita)
All countries that run eco-deficitsare dependent on ‘surplus’ biocapacity (exergy) imported from low density countries (like Canada) and the global commons. Gha/Cap
Symptom: Biodiversity Loss(The Competitive Exclusion Principle) • Growing the human enterprise necessarily degrades ecosystems and displaces other species from their habitats (biodiversity loss). • The current rate of species extinction is approximately 1000 times the pre-industrial rate. • With increasing resource scarcity, global change, and the morals of the ‘new world order’, the rich will also increasingly exclude the poor.
Competitive Exclusion: The expansion of the human enterprise… Human Ecological Footprint1961-2003
…necessarily displaces non-humans (Vulnerable ecosystems collapse before the human onslaught.) Living Planet Index1970-2003
20% of population 75% of world income 20% of population 1.5% of world income
Social Justice and the Income Gap • Income ratio between world’s richest and poorest countries in 1820: three to one. In 1998: 19 to one. • The richest 500 people in the world enjoy a combined income greater than that of the poorest 416 million. • The three richest people in the world had assets that exceeded the combined gross domestic product of the 48 least developed countries. • Income disparity is increasing both between and within countries, including Canada.
Symptom: Eco-apartheid - Competitively Excluding the Poor • ‘Eco-Apartheid’ is the effective segregation of people along environmental gradients • With increasing resource scarcity, global change, and the competitive ethic of the world economic order, the gradient is steepening. • Eco-apartheid is a contemporary reality—The rich live in the world’s healthiest, most productive habitats. Impoverished people and racial minorities are often segregated in urban slums and degraded landscapes characterized by toxic waste, polluted air and water and contaminated food with obvious public health implications.
Sunrise in Suzhou: What is Canada’s contribution to eco-degradation and damage to population health in China?
A Lesson from “Collapse: How Societies Choose to Fail or Succeed” (J. Diamond 2005) • Any society contains a built-in blueprint for failure if elites insulate themselves from the ecological and social consequences of irresponsible decisions. (This is the pattern among governing elites throughout history.) • By extracting wealth from ordinary people, distant countries and the global commons, they remain ‘well fed’ while everyone else suffers the effects of general decline. • The US [Canada?] is now a country in which elites increasingly cocoon themselves in gated communities guarded by private security patrols and filled with people who drink bottled water, depend on private pensions, and send their children to private schools (Moyers 2006).
With Knowledge Comes Responsibility • At the limits of biophysical carrying capacity, routine acts of non-essential consumption can result in violent harm to the poor and racial minorities. • Wealthy consumers who are ignorant of the distant systemic consequences of their material habits might be excused. However,... • Once we raise to collective consciousness the link between consumption, pollution and eco-violence, society has an obligation to view such violence for what it is. • Not acting to reduce or prevent eco-injustice converts erstwhile blameless consumer choices into acts of positive aggression.
Knowledge: Where We’re Likely Headed • 2015 is the last year in which “the world can afford a net rise in greenhouse gas emissions, after which ‘very sharp reductions’ are required” (IPCC Chairman, Sept 2007) • 5% or more of the worlds people (350,000,000) are likely to be displaced from their settlements by sea-level rise. (Stern report, 2006). • Up to two billion people worldwide will face water shortages and up to 30 per cent of plant and animal species would be put at risk of extinction if the average rise in temperature stabilises at 1.5C to 2.5C (IPCC, Sept 2007)
Solution: What the Science Says • “Industrialized world reductions in material consumption, energy use, and environmental degradation of over 90% will be required by 2040 to meet the needs of a growing world population fairly within the planet’s ecological means.” (BCSD 1993; ‘Getting Eco-Efficient’) • To avoid a mean global temperature increase above 2 C degrees, the world must reduce carbon emissions by 90% by 2050.” (Tyndall Centre for Climate Change Research 2006) • For sustainability with equity, North Americans should be taking steps to reduce their ecological footprints by 80% to their equitable Earth-share (1.8 gha).
The Other Inconvenient Truth: Eco-Footprints are Correlated With Lifestyle 12 April 2007
‘Losing weight’ need not be painful • In many rich countries neither objective nor felt well-being are still associated with rising GDP/income per capita. • On the contrary, “here we see US data showing “…the strange, seemingly contradictory pattern … of rising real income and a falling index of subjective well-being” (Lane 2000).
What do we Gain from GDP Growth in Rich Countries? (Siegel 2006)
Wasted Wealth: Diminishing Returns from Health Care Expenditures (Siegel 2006)
Essential Criteria for Sustainability • Biophysical: A society is sustainable only if it does not • consume resources faster than nature produces. • produce wastes faster than nature assimilates. • Social: A lifestyle is sustainable only if it could be extended to the entire human family without degrading the ecosphere and overloading global life-support systems. • Question: Can the already wealthy be persuaded to live on smaller footprints so the poor may live at all?
The Good News The Bad News “The ecologically necessary is politically infeasible but the politically feasible is ecologically irrelevant.” We have the technology today to enable a 75%-80% reduction in energy and (some) material consumption while actually improving quality of life. Yet we do not act. Privileged elites with the greatest stake in the status quo control the policy levers. Ordinary people hold to the expansionist myth. North American society remains in eco-paralysis.