Download

1 / 54
540 likes | 561 Vues
Learn about income and wealth inequality in the U.S., labor market features, income redistribution, and the distribution of economic well-being. Explore the measurement of economic inequality through income and wealth distribution.

E N D
18 CHAPTER Economic Inequality
After studying this chapter you will be able to • Describe the inequality in income and wealth in the United States and the trends in inequality • Explain the features of the labor market that contribute to economic inequality • Describe the scale of income redistribution by government
Rags and Riches • Homelessness and abject poverty exists alongside extreme wealth. • What determines the distribution of economic well-being? • How much redistribution does government do to limit extreme poverty?
Measuring Economic Inequality • The census bureau defines a household’s income as money income, which equals market income plus cash payments to households by the government. • Market income equals wages, interest, rent, and profit earned by the household in factor markets, before paying income taxes.
Measuring Economic Inequality • The Distribution of Income • Figure 18.1 shows the distribution of income across the 113 million households in the United States in 2005.
Measuring Economic Inequality • The mode income is the most common income and was about $13,000. • The median income is the level of income that separates the population into two groups of equal size and was $46,326. • The mean income is the average income and was $63,344.
Measuring Economic Inequality • A distribution in which the mean exceeds the median and the median exceeds the mode is positively skewed, which means it has a long tail of high values. • The distribution of income in the United States is positively skewed.
Measuring Economic Inequality • Figure 18.2 shows the distribution of income shares for the United States in 2005.
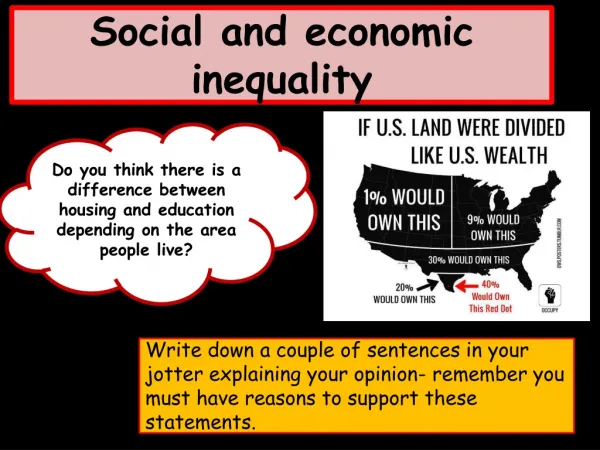
Measuring Economic Inequality • In 2005: • The poorest 20% of households received only 3.4% of the total income. • The middle 20% received 14.6% of total income. • The richest 20% received 50.4% of total income.
Measuring Economic Inequality • The Income Lorenz Curve • The income Lorenz curve graphs the cumulative percentage of income earned against the cumulative percentage of households. • Figure 18.3 shows the income Lorenz curve for the income shares in Figure 18.2.
Measuring Economic Inequality • The vertical axis of a Lorenz curve is the cumulative percentage of total income. • The horizontal axis is the cumulative percentage of households.
Measuring Economic Inequality • If everyone has the same income, • the income Lorenz curve is a 45 degree line from the lower left corner to the upper right corner. This line is called the line of equality. • The Lorenz curve shows the cumulative distribution of income.
Measuring Economic Inequality • The Distribution of Wealth • A household’s wealth is the value of all the things that it owns at a point in time. • The distribution of wealth is another way of examining the degree of economic inequality.
Measuring Economic Inequality • A wealth Lorenz curve measures the distribution of wealth in the same way an income Lorenz curve measures the distribution of income. • The distribution of wealth is even more unequally distributed than income.
Measuring Economic Inequality • Wealth Versus Income • Wealth is a stock of assets and income is a flow of earnings that result from a given stock of wealth. • The reason that wealth is more unequally distributed than income is that wealth does not measure the quantity of human capital—only income reflects the quantity of human capital. • Because wealth does not reflect potential for income from human capital, income is a more accurate measure of economic inequality.
Measuring Economic Inequality • Annual or Lifetime Income and Wealth? • A household’s income and wealth change over time. • A household headed by a young person starts out with moderate income and accumulates wealth for retirement years. • A middle-age headed household is in its highest earning years and enjoys the highest level of wealth. • A households headed by an older, retired person has lower earning and is consuming, rather than accumulating, its wealth.
Measuring Economic Inequality • Trends in Inequality • To measure inequality as an index number, we use the Gini ratio, which equals the ratio of blue area to the red area in the two figures below.
Measuring Economic Inequality • With perfect equality, the Lorenz curve is the line of equality and the Gini ratio is zero.
Measuring Economic Inequality • With the most extreme inequality—one person has all the income—the Lorenz curve runs along the axes and the Gini ratio is one.
Measuring Economic Inequality • The closer the Gini ratio is to one, the more unequal is the distribution of income. In 2005, the U.S. Gini ratio was 0.47.
Measuring Economic Inequality • Figure 18.5 shows the U.S. Gini ratio from 1970 to 2005. • The Gini ratio shows that the distribution of income in the United States has become more unequal. • Despite the change in the definition in 1992, the trend is still visible.
Measuring Economic Inequality • Who Are the Rich and the Poor? • Figure 18.6 on the next slide identifies the five characteristics that appear to influence the amount of income earned by a household. • These characteristics are • Education • Type of household • Age of householder • Race
Measuring Economic Inequality • Poverty • Poverty is a situation in which a household’s income is too low to be able to buy the quantities of food, shelter, and clothing that are deemed necessary. • Poverty is a relative concept. • In 2005, the poverty level calculated by the Social Security Administration for a four-person family was $19,971. • 37 million Americans lived in households with incomes below this poverty level—12.6 percent of the total population in 2005.
Measuring Economic Inequality • The distribution of poverty by race is unequal: • In 2005, 8.5 percent of white Americans lived in poverty compared to 22 percent of Hispanic-origin Americans and 25 percent of African Americans. • Poverty is also influence by household status: • More than 31 percent of households in which the householder is a female with no husband present had incomes below the poverty level.
The Sources of Economic Inequality • Inequality arises from unequal labor market outcomes and from unequal ownership of capital. • Two significant features of labor markets create income differences among individuals: • Human capital differences • Discrimination
The Sources of Economic Inequality • Human Capital • The more human capital a person possesses, the more income that person likely earns, other things remaining the same. • On the demand side of the labor market, high-skilled workers generate a larger marginal revenue product than low-skilled workers. • So firms are willing to pay a higher wage rate for high-skilled labor.
The Sources of Economic Inequality • Figure 18.7(a) shows the difference in demand curves for high-skilled versus low-skilled labor.
The Sources of Economic Inequality • On the supply side of the labor market, high-skilled workers incur a cost of acquiring their skills—money costs as well as time costs. • So high-skilled workers are willing to supply labor only at wage rates that compensate them for those costs, which exceed the wage rates at which low-skilled workers are willing to supply labor.
The Sources of Economic Inequality • Figure 18.7(b) shows the difference in supply curves for high-skilled versus low-skilled labor.
The Sources of Economic Inequality • Figure 18.7(c) shows the difference in equilibrium wage rates. • The higher demand and lower supply for high-skilled workers relative to low-skilled workers creates a higher equilibrium wage rate for those workers with greater human capital.
The Sources of Economic Inequality • Figure 18.8 shows how technological change and globalization combined with skill differences have widened the income gap between low-skilled and high-skilled labor. • The demand for low-skilled labor has decreased and the wage rate has fallen.
The Sources of Economic Inequality • The demand for high-skilled labor has increased and the wage rate has risen.
The Sources of Economic Inequality • Discrimination • Human capital differences can explain some of the economic inequality we observe. • Discrimination is another possible source of income inequality. • If the marginal revenue product of one race or one sex is perceived to be higher than that of another race or another sex, the equilibrium wage rates will vary across each racial or gender group, despite holding the level of human capital constant.
The Sources of Economic Inequality • Suppose that firms perceive white males to be more productive workers than black females. • Then the perceived marginal revenue product (which is also the labor demand curve) for white men would be higher than that for black women.
The Sources of Economic Inequality • Figure 18.9 shows the potential effect of discrimination of the wage rates of white men and black women. • If black women are discriminated against, the perceived MRP is lower and their wage rate and employment level decrease.
The Sources of Economic Inequality • If white men are discriminated for, the perceived MRP is higher and their wage rate and employment level increase.
The Sources of Economic Inequality • Economists disagree to the extent that discrimination pervades the labor market. • One line of reasoning states: Firms that discriminate would have higher production costs (pay higher wages for the same marginal revenue product) than those that do not. • If this line of reasoning is correct, • 1. The profit margins for the firms practicing discrimination will be lower. • 2. The market prices of their goods and services would be higher than non-discriminating firms.
The Sources of Economic Inequality • Either way, the market pressures increase the opportunity cost to firms (and the consumers who buy their product) for practicing discrimination, eventually eliminating these practices. • Another line of reasoning is that claims of sex discrimination can be explained by differences between the men and women regarding their willingness, on the average, to specialize in providing income generating labor versus providing non-income generating labor in the home.
The Sources of Economic Inequality • More women than men work at home for a portion of their adult life while engaged in child rearing and/or running the household. • This allocation of time means that women’s wages will be lower, on the average, than men’s wages. • Accounting for this difference in labor specialization has been found to explain much of the wage differentials between men and women.
The Sources of Economic Inequality • Unequal Wealth • The inequality of wealth (excluding human capital) is much greater than the inequality of income. • This inequality arises from savings and wealth transfers between generations. • There are two significant aspects of intergenerational wealth transfers that increase economic inequality: • 1. Debt cannot be transferred across generations • 2. Marriage concentrates wealth
Income Redistribution • The three main ways governments in the United States redistribute income are • Income taxes • Income maintenance programs • Subsidized services
Income Redistribution • Income Taxes • The U.S. federal government and most state governments tax incomes. • By taxing incomes of different levels at different tax rates, economic inequality can be decreased. • A progressive income tax is one that taxes income at an average rate that increases with income. • The U.S. income tax system and all state income tax systems are progressive income tax systems.
Income Redistribution • A regressive income tax is one that taxes income at an average rate that decreases with income. • A proportional income tax (also called a flat-rate income tax) is one that taxes income at a constant average rate for all income levels.
Income Redistribution • Income Maintenance Programs • Three major types of programs provide direct payments to individuals: • Social security programs • Unemployment compensation • Welfare programs
Income Redistribution • Subsidized Services • A great deal of redistribution takes the form of subsidized services—services provided by the government at prices below the cost of production. • An example is primary and secondary public education, as well as state colleges and universities. • The students at these institutions generally pay tuition and fees that range from 20 to 25% of the actual cost of educating a college student. • The families of these students enjoy a sizeable subsidy for acquiring human capital.
Income Redistribution • The Scale of Income Redistribution • Market income tells us what a household earns in absence of redistribution. • Start with market income then subtract taxes and add the amounts received from the government. • In 2001, the 20 percent of households with lowest incomes net benefits that increase their share of total income from 0.9 percent to 4.6 percent. • In 2001, the 20 percent of households with highest incomes paid net taxes that decreased their share of income from 55.6 percent to 46.7 percent.
Income Redistribution • Figure 18.10 shows the scale of government redistribution in 2001. • The blue curve show the distribution of market income distribution. • The green curve, the distribution after taxes and benefits, is … • …more equal than the distribution of market income.
Income Redistribution • The three lower income groups gain … • …and the highest income group loses.
Income Redistribution • The Big Tradeoff • Redistributing income leads to a tradeoff between equity and efficiency, known as the big tradeoff. Programs to redistribute income are inefficient for three reasons: • The process of income redistribution uses up resources that could have otherwise been used for producing goods and services. • Redistribution of income requires taxes to be imposed on the economy, which was shown in an earlier chapter to generate a deadweight loss in the markets that are taxed.