Download

1 / 26
280 likes | 432 Vues
Social Justice: Economic Inequality. By Doug Lenseth. Background.

E N D
Social Justice: Economic Inequality By Doug Lenseth
Background The topic of social justice is an important one for students to look at. Students are always talking about what is fair and what isn’t in our schools. In this specific week (which turns out to be the last one for the topic of social justice), the focus will be on economic inequality, which is one of the biggest issues society faces today. Students will explore what economic inequality means, who gains from it, who loses from it, and, if there is extra time, why it may occur.
Background (cont.) The math in these lessons will focus on representations. Students will see that economic inequality exists through the data that they look at, which will be represented in many different ways (e.g. tables, graphs, equations, etc.). Students will also be exploring other mathematical concepts, such as percents, ratios, statistics, and possibility probability, during the week.
Understanding Goals Topic related math related • Students will understand what economic inequality is and how it relates to the topic of social justice. • Students will understand who gains and who loses from economic inequality • Students will understand how and why economic inequality exists (if time permits) • Students will understand how to read and make multiple representations of data. • Students will understand percents and ratios in an applied setting. • Students will understand how statistics are used to show that a real-world phenomena exists.
Abstract – Day 1 • As an introduction to economic inequality students will be shown three different videos where a person of interest talks about economic inequality. After viewing these videos, students will get in their groups of four and will do a write-around, where they will be writing what they know about economic inequality after having watched the three videos. Groups will then share what they came up with in a whole class discussion. A homework assignment that addresses economic inequality will then be assigned.
Abstract – Day 2 • First, student’s homework from the previous night will be checked and gone over. Students will read two articles that deal with economic inequality and are heavy with multiple representations. Before, during, and after students are reading, they will complete a KWL chart. Students will also be encouraged to write down any questions they may have about the readings, while they are doing the readings. A class-wide discussion will then ensue around the articles, based on students’ KWL charts and questions. Before students leave, they will be required to write an exit slip stating what they have learned today and any lingering questions they may have. Homework will be assigned based on multiple representations.
Abstract – Day 3 • Students will be working in the computer lab during this class. Students will be shown a website, where a vast amount of information is available about specific groups of people and their economic standing. Students will be asked to focus on one group of people (a population). It could be a population that is relatively well off economically or it could be a population that is relatively not well off economically. Students will gather as much information about this population as they can, from both the website provided and any others they wish to use. Students will then write a faction based on the population they chose that shows how and why that population is economically better off or is not economically better off. Students will need to show this, using ratios of the data they found in class. Whatever students do not finish in class will be assigned as homework. The final draft of the faction will be due on the fifth day, so students can have the opportunity to revise and edit. In addition, students will receive their newspaper article assignment, where a rough draft will be due the next day.
Abstract-Day 4 • Students will be working on their newspaper articles and factions during this period. The newspaper article requires that students have at least one representation of data that they collect. The article can be about anything pertaining to economic inequality and the population they have chosen for their faction (that way no extra research will be needed). This class will act as a writers workshop where students will spend time writing, revising, and editing both their factions and newspaper articles, while the teacher walks around the room and checks the progress of each student. The final drafts of both the factions and the newspaper articles will be due the next day.
Abstract-Day 5 • Students will hand in their newspaper articles and will get in their groups and put their articles together to form a bigger newspaper and discuss it. Then, students will write a reflection about what they think social justice is, after learning about it in 8 weeks and in different subject areas. They will also write about new specific content knowledge they have gained as a result of going through the 8 weeks of learning about social justice.
Abstract – Assessment • Students will have a couple of a different assessments they will have to perform, many of which are formative. The write-arounds, KWL charts, class-discussions, exit slips, and the final reflection will act as formative assessments as it is hoped that students will learn a lot while completing these assessments. These assessments will only be graded based on participation and completion The faction and newspaper article will be used as the summative assessments, although they are meant to be formative in nature as well, as students will be learning through the writing and revising process.
Required Tools • Copies of printed online articles • Computer lab with internet access • Projector hooked up to a computer to show YouTube videos.
Lesson Plan Details – Day 1 • Students will be shown the following three videos to start class off: • http://www.youtube.com/watch?v=xg2dN5v77Ic • http://www.youtube.com/watch?v=pGYw9fFLzSk • http://www.youtube.com/watch?v=ZcQ_Pf7p_VI • Students’ attention will be focused on what economic inequality is and any mathematical evidence that the people speaking give of economic inequality. (Overall, this will take about 10 minutes) • Students will then get into their groups of four that they have been using throughout the whole social justice unit and will perform a write around, where they will write what they know about economic inequality after having watched the three video clips. They will also be asked to make comments on how economic inequality ties in with social justice. They will will also be asked what type of mathematics are present when talking about economic inequality. (15 minutes)
Lesson Plan Details – Day 1 (cont.) • After students have completed the write around each group will report out on what they think economic inequality is, why they think economic inequality ties into a unit called social justice, and what type of mathematics are present when talking about economic inequality. (15 minutes) • Students will then be assigned a homework where they will be using mathematics and social justice together (see next slide for some sample questions from homework).
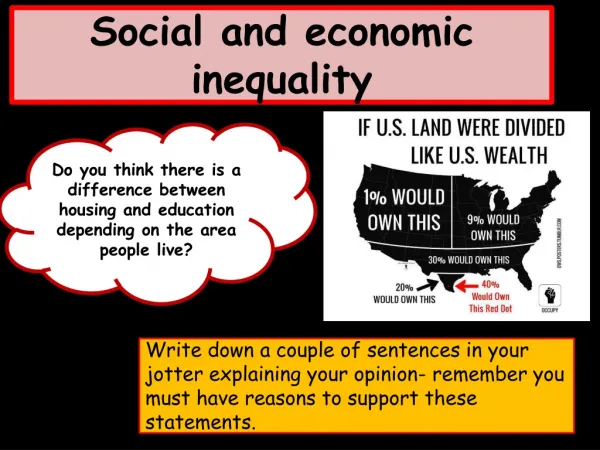
Homework Sample Questions Day 1 • The following situations are totally hypothetical and are not based on real data: • If there is a total of $2,000,000,000 in wealth in Country A and there are 50,000 people in Country A and in Country A economic inequality DOES NOT exist, then how much wealth would each person have? • Using the same information from question 1, if 70% of the wealth is owned by 10% of the population, what is the average wealth of that 10%? What is the average wealth of the other 90%? • Again, using the same information from question 1, if 90% of the wealth is owned by 1% of the population, what is the average wealth of that 1%? What is the average wealth of the other 99%? • Which case (2 or 3) do you think most closely resembles the United States as it is today? Explain .
Lesson Plan Details – Day 2 • Students will come in and have their homework from day 1 out and ready to be checked by the teacher. We will then go over the homework, focusing on questions 2 and 3 to make sure students solved those correctly. (10 minutes) • Students will then be assigned two articles to read individually on economic inequality that include multiple representations of data. Here are the two articles that students will be reading, which will be printed out for them: • http://www.heritage.org/research/welfare/bg1796.cfm • http://www.demos.org/inequality/numbers.cfm
Lesson Plan Details- Day 2 (cont.) • Before, while, and after reading, students will be completing a KWL chart. Students will also be encouraged to jot down any questions they may get while they are reading. (15 minutes) • After students have read the articles individually, the class will come back together and discuss the articles and how much the different representations helped them understand how economic inequality exists in the United States. (12 minutes) • Finally, students will write an exit slip stating what they have learned and any questions they may still have after doing the readings and participating in the discussion. Students will also receive their homework assignment , which will be based on multiple representations, while they hand in their exit slips. (3 minutes)
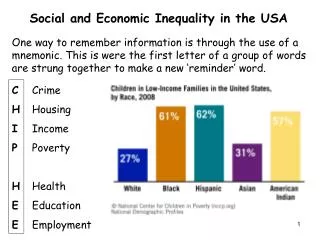
Homework Sample Questions Day 2 • For this homework, students will be given lots of data, given in lots of different representations (e.g. tables, graphs, etc.) that deal with economic inequality (although data will be completely made up and is not shown here). Here are some sample questions that students may see on this homework assignment: • Based on the information provided, how much wealth does the top quartile of the population own? How does that compare to the other three quartiles? • Based on the information provided, what percentage of wealth do African Americans own? Asians? Whites? Hispanics? What does this tell you about the economic standing of these individual groups? Do you think economic inequality exists in this situation? • Based on the information provided, compare the average incomes of men and women? Do you think economic inequality exists in this situation?
Lesson Plan Details-Day 3 • Students will come into the computer lab and have their homework from day 2 out and ready to be checked by the teacher. We will then go over the homework, making sure students understand how to read the different multiple representations. Also, any big misconceptions and/or questions will be addressed from the previous day’s exit slips. (10 minutes) • The teacher will then show students one particular website (which is a PDF file: http://www.census.gov/prod/2008pubs/p60-235.pdf) that contains some real data about different groups of people and their incomes (pgs. 13-19). The focus will be on the multiple representations, and again how to read them. Students will notice that there may be a lot of information that is irrelevant to them that they can ignore. (5 minutes)
Lesson Plan Details- Day 3 (cont.) • Students will then be asked to pick their own group of people in the United States (a population) and do some research on their economic standing. Students can pick populations that are well-off or populations that aren’t so well-off. Students can use the site that was shown in class, or they can find their own information. With this information in hand, students will write their own faction about the population, using information they found. This faction will be a story that tells how this particular population might have gotten to the point they are at now (relatively rich or poor). The faction needs to be 2 typed double spaced pages long. Students will be expected to get most of the writing done in class, but anything they don’t finish will be homework, as a rough draft is due the next day (25 minutes) • In addition to the faction, students will also receive the assignment for their newspaper article, where they will write an article about the particular population they chose today that includes all factual information and must include at least one representation of real data. A rough draft of this will also be due the next day.
Lesson Plan Details- Day 4 • Students should have the rough draft of both their faction and their newspaper article done for this class. This class will act as a writers workshop type class. Students will continue writing, if need be, then will be revising and editing. Students will have opportunities to use each other for peer feedback, when revising and editing. The teacher will meet with individual student for a very short period of time (2-3 minutes per student) to make sure they are all on track and ready to write their final drafts. The teacher will address the whole class, if need be, if any major misconceptions need to be cleared up by the end of the class. Otherwise, students will just be writing so they can complete both of their final drafts for class the next day. The only homework from this class will be to complete final drafts of both the faction and the newspaper article for the next day. (40 minutes)
Lesson Plan Details-Day 5 • The first thing students will do for this class is hand in their final draft of their faction. Next, students will get into their groups and combine their newspaper articles to form a bigger newspaper. Students will discuss why the chose the representations that they used and what information they were trying to convey, through this representation, to their group members. Then a class discussion will ensue about the same ideas. (20 minutes) • Next, students will write a 1-2 page reflection about what they think social justice is now after going through 8 weeks of learning about various aspects of social justice in different subject areas. Students will also write about new content , for each subject area, they learned while going through this unit. This will only be assessed based on completion. The content of what they write will not be assessed, only the fact they answered both prompts. Students need to finish this before leaving class. (20 minutes)
Lesson Plan Details-Assessment • Students will have a total of eight assessments during the week. Six of those assessments are going to be graded on participation and completion only. The other two (the faction and the newspaper article) will be graded based off a rubric (displayed on the next two slides). The total grade for the week will be out of 100 points • Here is the point breakdown: • Participation in write-around (5 points) • Completion of day 1 homework (10 points) • Completion of KWL charts (5 points) • Completion of an exit slip (5 points) • Completion of day 2 homework (10 points) • Completion of final reflection (15 points) • Faction (25 points) • Newspaper Article (25 points)
Lesson Plan Details –AssessmentRubric 1 • Faction Appropriate group is chosen 1 2 3 4 5 • An appropriate group of population is chosen and their economic status is described in sufficient detail Reasons for inequality 1 2 3 4 5 • Possible reasons (either real or made-up) are sufficiently described for why this group has attainted the economic status they have Mathematical evidence included 1 2 3 4 5 • Mathematical evidence (ratios) is included somewhere in the article that shows whether or not this group is well-off economically. Creativity 1 2 3 4 5 • The story itself is very creative and includes both factual information to go along with bits and pieces that spice up the story Conventions 1 2 3 4 5 • The story is well written with correct spelling, grammar, etc.
Lesson Plan Details –Assessment Rubric 2 • Newspaper Article Appropriate group chosen 1 2 3 4 5 • An appropriate group of population is chosen and their economic status is described is sufficient detail Use of Mathematical Evidence 1 2 3 4 5 • Real mathematical evidence is provided in the article as to why the group chosen is well-off or not well-off. Use of multiple representations 1 2 3 4 5 • Student uses at least two different representations for the data they include in the article. Appropriate length 1 2 3 4 5 • Length is appropriate for a newspaper article. The article is not too long, but it is long enough to give enough detail to readers as to what is going on. Conventions1 2 3 4 5 • The article is well written with correct spelling, grammar, etc
Lesson Plan Details – Assessment (cont.) A quick note on the rubrics: The rubrics use a scale of 1 to 5, where 1 means that the given criterion was not done or was done very, very poorly, and a 5 means that the given criterion was included with sufficient detail and was completed with no errors. Anything in between includes anywhere from a few errors, which would be a 4, to many errors, which would be a 2.
New York State Mathematics Standards • The following are some of the New York State Standards that should be attained during the week of lessons: • A.PS.2 Recognize and understand equivalent representations of a problem situation or a mathematical concept • A.PS.4 Use multiple representations to represent and explain problem situations (e.g., verbally, numerically, algebraically, graphically) • A.CM.2 Use mathematical representations to communicate with appropriate accuracy, including numerical tables, formulas, functions, equations, charts, graphs, Venn diagrams, and other diagrams • A.CM.4 Explain relationships among different representations of a problem • A.CM.12 Understand and use appropriate language, representations, and terminology when describing objects, relationships, mathematical solutions, and rationale • A.CN.1 Understand and make connections among multiple representations of the same mathematical idea • A.CN.3 Model situations mathematically, using representations to draw conclusions and formulate new situations • A.CN.6 Recognize and apply mathematics to situations in the outside world • A.R.2 Recognize, compare, and use an array of representational forms • A.R.5 Investigate relationships between different representations and their impact on a given problem • A.R.7 Use mathematics to show and understand social phenomena(e.g., determine profit from student and adult ticket sales)