Download
1 / 39
390 likes | 592 Vues
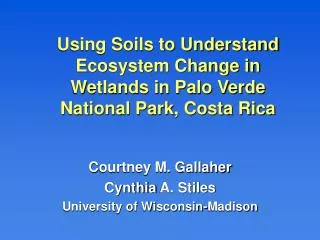
Using Soils to Understand Ecosystem Change in Wetlands in Palo Verde National Park, Costa Rica. C ourtney M. Gallaher Cynthia A. Stiles University of Wisconsin-Madison. Palo Verde National Park.

E N D
Using Soils to Understand Ecosystem Change in Wetlands in Palo Verde National Park, Costa Rica Courtney M. Gallaher Cynthia A. Stiles University of Wisconsin-Madison
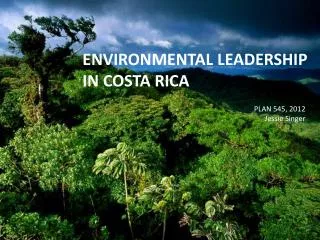
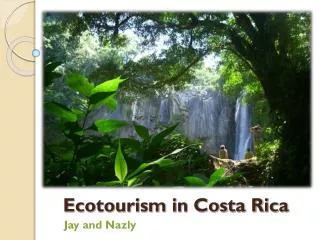
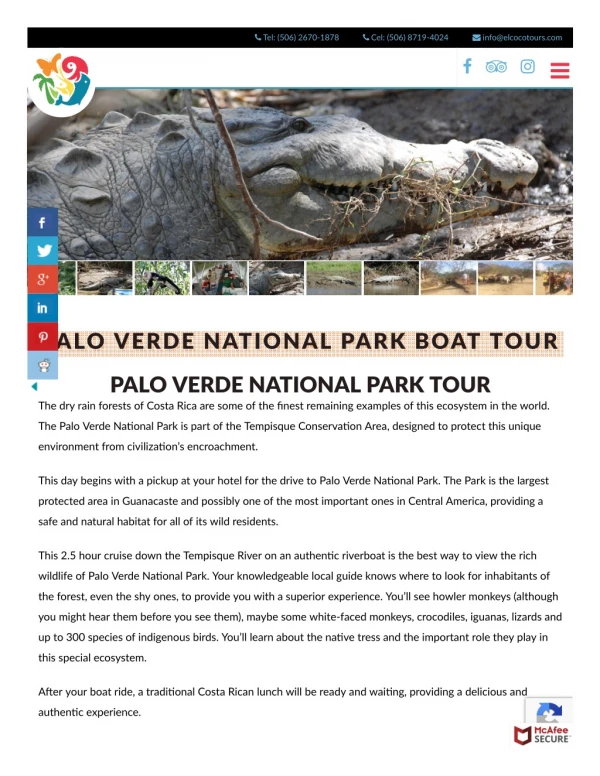
Dry tropical forests are presently one of the most endangered ecosystems on earth, threatened by both expanding development and agriculture. Palo Verde National Park in northwestern Costa Rica is an outstanding example of a large wetland within a dry tropical forest. It is located in the Guanacaste region along the lower reaches of the Tempisque River, the second largest river in Costa Rica. The climate for the area has a pronounced dry and wet season, with most rain (180-220 cm) falling between the months of April and October. The mean annual temperature is 28°C and varies little throughout the year.
Changes in the Palo Verde Wetlands-Aggressive cattail invasion- 2002 1996
The park provides diverse habitat for thousands of birds that roost and nest here as they migrate between the continents. Birdwatching attracts many ecotourists and represents a vital source of revenue for this area. Recently the native vegetation in the open water marshes that were once suitable to migratory waterfowl has been replaced by dense stands of invasive cattails, possibly a hybrid between the non-aggressive native species and European strains. These changes in vegetation have had severe repercussions on the wildlife in the area which may eventually impact the ecotourism industry, which relies on the abundant bird populations attracted to open water margins.
Recent Changes in Vegetation Possible causes; • Changes in hydrology and sedimentation due to flooding during Hurricane Mitch in 1998 • Irrigation run-off from nearby rice agriculture
What may be causing this recent drastic change in the vegetation? A major problem in identifying the cause of the cattail invasion is a general lack of knowledge of the soils of Palo Verde National Park. Because soils form the matrix in which plants grow, a good understanding of soil properties is necessary to understand the ecological processes that have led to the cattail invasion. A possible recent cause may be flooding of the park by Hurricane Mitch, which struck Central America in 1998. This area is seasonally flooded by monsoons, but storms the size of Hurricane Mitch hit western Costa Rica approximately once every 100 years. Recent agrarian activities (forest clearance and field expansion) may have contributed to enhanced sediment loads during this event.
When Hurricane Mitch flooded the wetland area, it likely changed local hydrology and soil properties. Specifically, the influx of a large volume of rainwater may have changed the water chemistry of the brackish wetlands and tipped the balance to a strongly freshened condition, more conducive to cattail growth. In addition, flooding may have deposited fresh sediment that dramatically altering the soil matrix, releasing many water-soluble nutrients that would aid in the establishment of cattail colonies and explain the disappearance of the native vegetation. Finally, irrigated rice agriculture, a fairly recent component in agrarian component, may also be enhancing marsh eutrophication through the addition of soluble nutrients and possibly pesticides.
Research Questions • Is the marsh experiencing passive salinization due to a wet-edge effect? • Is the surface water of the marsh freshened due to changes in sedimentation and hydrology?
In order to understand whether the observed changes in vegetation are symptoms of a larger ecosystem change, I asked two questions. First, is the marsh experiencing passive salinization due to a wet-edge effect? In essence, are salts in the ground water being drawn up into the wetland soils, causing soil salinization? And second, is the surface water of the marsh freshened due to changes in sedimentation and hydrology? As previously discussed, flooding may have added sediment layers to the wetland soils changing local hydrological patterns.
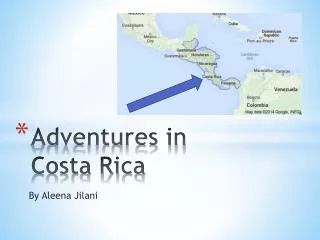
This map shows the location of Palo Verde National Park. The Tempisque River is an estuary along the lower margins of the park and, along the extent of the park, reverses its flow with the tide. Initial fieldwork for the study was conducted by a team of researchers from the University of Tennessee, including Cynthia Stiles who is presently at the University of Wisconsin.
Fieldwork included soil profile descriptions at two sites within the park, the Chamorro floodplains and the Laguna Bocana wetlands. Soil samples were collected from these soil profiles. The Chamorro site is close to the river itself (within the reversing flow regime) and represents a normal floodplain sequence. Three profiles were excavated near the essentially closed basin wetland in Bocana. Note the network of irrigation canals outside the limits of the park and how the surface hydrologic pattern suggests that excess run-off from irrigation is directed down into the restricted wetland system. Bocana is in essence a “sump” for the drainage water from the upstream irrigation, which introduces excessive water to the system during the driest part of the year. Remember that these are soils originally formed under monsoonal climate cycles.
Chamorro alluvial plain Vertisol A Bss1 Bss2 Bss3 Bsskg Bssg
The baseline soil for the study, from near the Tempisque River, is a Vertisol. This is a very clay-rich soil formed from overbank deposition from the Tempisque. The floodplain on which this soil is found extends for a considerable distance along the Tempisque and ranges from 2-6 km wide. The soil has slickensided aggregate structure, most strongly expressed at 0.5 – 1.0 m depth (Bss horizons). There is also some accumulation of pedogenic carbonate below 1.5 m (Bssk horizons). Embedded within the profile are occasional layers of erosional pedorelicts that may have been carried down from past large volume flood events.
Laguna Bocána wetland margin A Bw 2Byk 2Byg 3Bwb
Other profiles excavated closer to the edge of the Bocana marsh had “lithologic discontinuities” which represent deposition from different storm events. The textures vary irregularly, as will be shown in the particle size distribution figures. The horizon designation “By” indicates that there is at least 5% gypsum (by volume) present in this profile and the designation 3Bwb indicates a buried soil subsurface horizon from an earlier sequum that contains relict mangrove roots.
Methods of Analysis • Particle size • Soil texture • Sediment deposition • Hydrology • Water soluble elements • Nutrients released during flooding • Salt accumulations
To help address the hypotheses, I analyzed the soil samples taken from the Palo Verde profiles for particle size distribution and nutrient contents. Particle size distributions allow you to draw conclusions about soil texture, sediment deposition in the basin as well as local hydrology, and I measured this using the pipette method. Water soluble elements characterize nutrients released during a flood event such as Hurricane Mitch, as well as soluble salts accumulated in the soil horizons. To measure this, I used a 1:10 pore volume to water solution
Particle Size Distribution Bocana 3 2 m Bocana 2 Chamorro Bocana 1
This is a simplistic diagram outlining the toposequence along which the soil samples were collected, and the textures of each horizon within the soil profiles. The Chamorro soils are classified as Vertisols because they had high clay content. The Bocana soil textures on the other hand, contain far more sand and silt than Chamorro, indicating their more active role in intercepting sediment during erosional events. Yet, all three Bocana soils have clayey A horizons. This strongly suggests deposition of clays due to erosion of upland soils during the monsoons. The large floods of Hurricane Mitch probably carried large quantities of clays from the uplands down into the Bocana wetland basin. This simple change in particle size within the sediments would have a profound effect on the hydrology of the wetland system. Clays have a restrictive influence on infiltration and tend to act as localized aquitards. There is a shallow aquifer within the soils (1-1.5 m deep) that carries dissolved salts from the irrigated fields. Clay caps seal this from meteoric interaction.
ChamorroRelationship between NaH2O and soil texture Sodium Sand
One of the most striking results of the water soluble nutrient analysis was the high concentrations of salts in many of the Bocana soil horizons. To better understand why the salt has concentrated in the Bocona soils, on the graph I have plotted both the percent sand and the ppm of sodium against the soil depth. This allows us to see any significant textural variations that would influence water flow as well as salt accumulations in the horizons. The Chamorro soils are considered the control for this investigation and show little response of sodium to the textural increase in sands at about 100 cm depth. These soils are largely clay-dominated and sodium accumulation is more an effect of the proximity of the lowest B horizon to the brackish water from the Tempisque estuarine system. The next three slides graph sand and salt vs. depth for the three Bocana soils.
Bocana 1Relationship between NaH2O and soil texture Sodium Sand
In contrast to the Chamorro soils you can see a strong correlation between the soil texture and the salt concentration in the Bocana soils. Also note that sand and sodium axes are an expanded range from the previous Chamorro slide. Bocana 1 is located closest to the wetland. Sand percentages, indicated by the blue line, are highest at the top and bottom of the soil profile as are the salt concentrations. However, salt is concentrated in the finer textured horizons just below the coarser sandy horizon
Bocana 2Relationship between NaH2O and soil texture Sodium Sand
Bocana 2 is located between the wetland and the upland area. This profile shows two pronounced sand lenses at 40 cm and 80 cm with roughly corespondent increases in sodium. This bimodal distribution is due to the geomorphically active nature of this position – it is close enough to the wetland to experience overbank deposition during flooding, yet far enough away to avoid erosion. It is important to note that the lower sodium increase occurs slightly below the sand increase, suggesting that sodium is diffusing downward from this conductive layer into the finer texture sediments. The offset here is not as pronounced as the offset found closer to the wetland. This soil also has the most elevated concentrations of sodium.
Bocana 3Relationship between NaH2O and soil texture Sodium Sand
Finally, Bocana 3 is on a slight upland rise away from the wetland. An increase of sand occurs most prominantly at 35cm with sodium again increasing below the sandy horizon, possibly due to diffusion of salts from the hydraulically conductive horizon (shallow aquifer). Although the data is not shown here, the trends noted in sodum distribution are also found in sulfate and also in other cation concentrations (data not shown here) indicating increasing soil salinization. So what causes this pattern of salt accumulation beneath the coarser textured soils?
Wet-Edge Effect Steinwand and Richardson, 1989
Most likely, the salt accumulations seen in the Bocana soils are due to the wet-edge effect. Flow reversal, when recharge changes to discharge or vice versa, often occurs near wetland edges such as the Bocana soils. After a rainfall event, water shunted to the pond edge creates a mounded water table. Because the water table is already near the surface of the soil, the shunted water table will actually rise above the level of pond and creates a miniature drainage divide. When this happens, the soil is leached. The water table mound is removed by water losses, and replaced soon after the rain by a depression in the water table. Alternation between mound and depression phases restricts water movement to the wetland, and during the evaporative phase soils accumulate sodium and sulfur salts. Palo Verde experiences intense dry seasons during 6 months of the year, and salts accumulate due to evaporative draw up of the brackish ground water. More porous sandy layers impede the upward movement of the salt water through the soils and the salts accumulate in the horizons just below. In addition to this, because of the recent clay layer at the surface of the horizons, salts are no longer rapidly leached from the soils during rainfall events as they once were, which contributes to the salinization of these soils.
Particle Size Distribution Bocana 3 Bocana 2 Bocana 1 X X X Water Salt
In the Bocana soils, before the arrival of the clay textured A horizons, the upper horizons of each profile went from high porosity to low porosity, which meant that water easily flowed through the upper horizons via normal seasonal infiltration. The addition of a clayey A horizon changed the scenario, in a sense sealing off water movement through the surface horizon. A large influx of fresh water, with a clayey A horizon that impedes rapid filtration of this fresh water down into the brackish groundwater, likely caused basin wide freshening of the water. Because cattails germinate and thrive in less saline conditions than many of the native species adapted to brackish conditions, this sediment deposition is likely part of the reason for the cattail invasion of the marsh.
Summary • Is the surface water of the marsh freshened due to changes in sedimentation and hydrology? • YES- deposition of clay sediments now impedes water flow through the soil causing basin wide freshening
Summary • Is the marsh experiencing passive salinization due to a wet- edge effect? • YES- salts accumulate during the dry season in finer textured horizons.
Conclusion • Changes in vegetation are symptoms of much larger ecological changes • Soil salinization • Surface water freshening • Restoration of the wetland involves many natural and social factors and will take a long time
Thanks! La Pura Vida! Cynthia Stiles University of Wisconsin-Madison Drs. Sally Horn, Steve Driese, and Claudia Mora University of Tennessee