Download
1 / 101
1.01k likes | 1.23k Vues
Analysis of large groups of genes. Petri Toronen Firstname.Lastname@helsinki.fi. Content. PART I: Analysis of groups of genes with functional classes Do I need to analyze large gene groups ? Functional classification of genes Over-representation analysis methods

E N D
Analysis of large groups of genes Petri Toronen Firstname.Lastname@helsinki.fi
Content • PART I: Analysis of groups of geneswithfunctionalclasses • Do I need to analyzelargegenegroups? • Functionalclassification of genes • Over-representationanalysismethods • Gene Set EnrichmentAnalysis (GSEA) methods • Whatcomes out? • Furtherapplications • Whenthesemethodswillfail • Conclusion
Content • PART II: Analysis of gene groups with gene networks • Why gene networks • What are different gene/protein interactions • Where can we get the data • Usage of interaction datasets • Flaws of interaction datasets • Conclusions
Content • Do I need to analyze large gene groups? • Functional classification of genes • Over-representation analysis methods • Gene Set Enrichment Analysis (GSEA) methods • What comes out? • Further applications • When these methods will fail • Conclusion
Do I need to analyze large gene groups? • Biology more and more High Throughput • Understanding N*100 gene list is hard • Errors in data • Popular in literature, reviewers might require • These can ease the data analysis
Examples of large-scale datasets • Gene expression datasets • Large scale genome wide associations (GWAS) • Enviromental microbial samples (metagenomics) • Comparing two or more genomes for missing genes (phylogenetic footpronting)
Errors in data • All high throughput methods have been shown to generate also error results • Technical biases, sample preparation, dyes, different lab workers • Variances between laboratories, sample preparation in the lab • Biological variation between the individuals, samples
Errors in data => Interesting gene might not be reliable observation!
Thinking the data analysis • Biology usually looks at obtained genes
Thinking the data analysis • Biology usually looks at obtained genes • But genes are often not the main interest!
Thinking the data analysis • Biology usually looks at obtained genes • But genes are often not the main interest! • Usually it is the biological processes, the functions we are interested
Thinking the data analysis • Biology usually looks at obtained genes • But genes are often not the main interest! • Usually it is the biological processes, the functions we are interested • Active genes can vary while the same process is active (Linghu et al. 2009, Efron, Tibshirani 2007, Subramanian 2005) http://arxiv.org/pdf/math/0610667.pdf http://www.biomedcentral.com/content/pdf/gb-2009-10-9-r91.pdf
Thinking the data analysis • Monitoring genes requires detailed knowledge on gene functions • Genes can have multiple functions • Secondary function might go unnoticed • Objectivity • We easily find what we expected to find
Over-representation analysis • Motivation to over-representation analysis • Over-representation analysis methods • What over-representation analysis always requires • What the results look like
Typical analysis pipeline Generate the GE data Gene expression analysis Pre-processing (Normalization etc.) DefineDifferentially Expressedgenes Over-representation analysis Collectfunctionalannotations for all the genes Comparefunctionalclasseswith the analyzedgenegroup. Useselectedstatisticalscore Selectover-represented biologicalprocesses
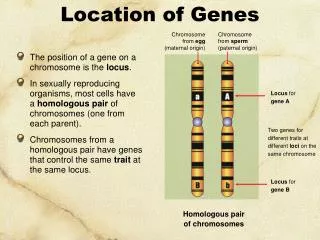
Information on gene functions • Gene functions can be represented as categorizations: • Gene belongs to category when it has a function • Gene can belong to many categories • Some categories can lie within each other • Smaller more precise categories are nested within larger category • Different levels of information on gene function
Information on gene function • Where do we get the functional categorization?
Information on gene function • Where do we get the functional categorization? • We use existing functional classifications from databases that provide them • Biological Processes • Molecular Functions … • Laboratory can also generate its own functional classifications
Functional classes Genes information of the functions can be obtained, for example, using some genome database (MIPS, SGD) Cell cycle G1 Apoptosis G2 Neurogenesis G3 Cell death G4 ATPase activity Obtained association data can be turned into a binary matrix 1 indicates association and 0 no association T1 T2 T3 … T1 G1 G1 1 0 1 … T2 G2 0 1 0 … G2 T3 G3 0 0 0 … G3 T4 G4 0 0 0 … G4 T5 … … … … …
Functional annotation standards • Gene Ontology (GO) • Reactome (Biochemical Pathways) • KEGG (Kioto Encyclopedia of Genes and Genomes) (not freely available anymore) • SwissProt keywords • MIPS FunCat (Functional Catalogue) • Molecular Signatures Database (MSigDB, MIT) => You can use many of these simultaneously
Benefits of Gene Ontology (GO) • Many gene features are covered • Biological Processes • Molecular Function • Cellular Component • Hierarchical sophisticated struture • Detailed and broad categories are included to structure • Most used, popular standard • Many organisms are covered • Information source reported • GO Evidence Codes
Drawbacks of GO • Unstablestructure • New classesappear and oldonesdisappear • Mostannotationsarenotmanuallyevaluated* • Someannotationsarebound to bewrong • Genefunctionmightvary, for examplebetweentissues* • Genesroughlycategorized to classes* • In realitygenesaremoreorlessrelevant to somefunction / pathway • Genefrompathwaycanupordownregulate the synthesis *Problem is not specific to GO. It rather links to all functional classifications
Motivation of the over-representationanalysis • Aim is to summarize gene functions observed in the analyzed group of genes • It would be intuitive to report the most common functional classes from the gene list
Motivation of the over-representationanalysis • Aim is to summarize gene functions observed in the analyzed group of genes • It would be intuitive to report the most common functional classes from the group of genes • However, the most common classes are often the most common also in the background
Motivation of the over-representationanalysis • Aim is to summarizegenefunctionsobserved in the analyzedgroup of genes • Itwouldbeintuitive to report the most common functionalclassesfrom the group of genes • However, the most common classesareoften the most common also in the background • Wewouldratherwant to reportthe mostover-represetedclasses
Over-representationanalysismethods • Over-representation analysis looks classes that are more frequent in gene group than in the background • Most popular tests are based on sampling without replacement Sampling w/o replacements answers to: How many ways there are to select 8 balls so that two of them are white and rest are black from the whole data?
The sampling without replacement can be turned to a p-value using Fisher’s exact test (or hypergeometric test). This is done by summing probability for observed outcome (6 black balls) with the probabilities of more extreme outcomes (7 and 8 black balls). This is a standard available in many web tools. Figure shows the probabilities for every possible outcome in the example. The p-value for previous sample (6 black balls would be obtained by summing three leftmost bars) p-value: 0.621 http://en.wikipedia.org/wiki/Hypergeometric_distribution http://en.wikipedia.org/wiki/Fisher%27s_exact_test
Over-representationanalysismethods • Various methods used: • Hypergeometric test • Binomial test • Chi Square test (bad) • Less used methods reporting same: • Jaccard correlation • Log-likelihood ratio aka. G-statistics (Mutual Information) http://en.wikipedia.org/wiki/Binomial_test http://en.wikipedia.org/wiki/G-test http://en.wikipedia.org/wiki/Pearson%27s_chi-squared_test http://en.wikipedia.org/wiki/Jaccard_index
What statistics calculate • Hypergeometric test is based on sampling w/o replacement • Binomial test is based on sampling with replacement • This model is true when the dataset is much larger than the sample • Binomial test is often used to approximate hypergeometric test
What statistics calculate • Log likelihood ratio (LLR, G-test) is based on ratio of likelihoods between two models: • Maximum Likelihood model • Null model • It approximates binomial test • Chi Square test approximates LLR. Chi square test is popular but it is not recommended.
What statistics calculate • Jaccard correlation (JC) is different. It is ratio between: • the size of intersection (∩) between functional class and gene group (number of genes in both sets) • The size of union (U) between functional class and gene group (number of genes in either set) • JC = (A ∩ B )/(A U B) • JC does not tell how significant the result is
Over-representationanalysismethods:Whatvaluesmethodsneed • Hypergeometrictest (= Fisher’sexacttest, hypergeometricp-value) • X: Number of classmembers in the genegroup • K: Size of the genegroup • N: Size of the wholedataset • L: Number of classmembers in the wholedataset • Binomialp-value, log-likelihoodtest (= G-statistics), ChiSquare test • X: Number of classmembers in the genegroup • K: Size of the genegroup • P: Probability of classmembers in the background (P = L/N)
What the results look like • Sorted lists of significant functional classes • Visualization of classes in the structure of the functional class hierarchy
Graphical output • classes with high over-representation can be visualized using the GO structure • well-scoring classes are highlighted
Better pipeline: Permutations Tolvanen et al. 2009 http://www.sciencedirect.com/science/article/pii/S1532046408001445 Repeat N*100 times Collectfunctionalannotations for all the genes Permute (mix) the annotations randomlyacross the genes Comparefunctionalclasseswith the analyzedgenegroup. Useselectedstatisticalscore Comparefunctionalclasseswith the analyzedgenegroup. Useselectedstatisticalscore Selectover-represented biologicalprocesses Selectover-represented biologicalprocesses Compare the resultswithcorrect data to the permuted data. Reportonlyclassesthathavebetterscorethan the permutations
Permutations • Sanity check: What results can be obtained from random data? • First method (Row permutation, gene permutation): • Repeat following step, say 200 times • Permute the functional annotations • Rerun the analysis • Store the results • Compare the results from true data to the permuted data
Permutations • Second method (column permutation, sample permutation): • Repeat following steps, say 200 times: • Permute the labels of (gene expression) samples • Rerun the (gene expression) data analysis • Take the significantly regulated genes • Rerun the over-representation analysis with regulated genes • Compare the results from each class true data to the permuted data • Heavier but still preferred permutation idea • Might not always be applicable
Permutations Sample labels Expression data Row rand. Class data Col. rand
Permutations • Tian et al. 2005, PNAS (http://www.pnas.org/content/102/38/13544.long) • Efron & Tibshirani, 2007, Annals of Applied Statistics (http://arxiv.org/pdf/math/0610667.pdf) • Goeman & Buhlmann, 2007, Bioinformatics (http://arxiv.org/pdf/math/0610667.pdf) • Törönen et al. 2009, BMC Bioinf. (http://www.biomedcentral.com/1471-2105/10/307) Some say one is better than other. Me and Tian et al. propose: Test both and expect the worse result to be true.
Multiple Testing Problem • Werunover-representationanalysiswithmanythousandsclasses. Whatcangowrong? • Thinkthrowing a dice. • Withonedice the probability of getting 6 is 1/6 • With 10 dices the probability for one 6 is muchlarger (~0.8) • Samephenomenaoccurswithfunctionalclasseswhenwe look at the best-scoringclasses. • Thisneeds to becorrected
Multiple Testing Problem • Several alternatives to correcting the phenomena • These require the obtained best results to be better than what could be expected by random from the set of N experiments. • Holm’s correction • Bonferroni correction • False Discovery Rate (FDR) • ..others…
Further ideas Simple extensions to over-representation analysis: • Search of clusters from hierarchical cluster tree • Analysis of functional subgroups from the generated gene list
Analyzing the heterogeneity of the gene list analyzing a gene list as one entity for over-represented gene classes is standard. Problem: The best scoring gene group tends to overwhelm the results. Pehkonen et al., BMC Bioinformatics 2005 The gene list Functional classes T1 G1 T2 G2 T3 G3 T4 G4 T5 G5 T6 G6 T7 G7 T8 G8 T9 T10
Analyzing the heterogeneity of the gene list analyzing a gene list as one entity for over-represented gene classes is standard. Problem: The best scoring gene group tends to overwhelm the results. Pehkonen et al., BMC Bioinformatics 2005 The gene list Functional classes T1 G1 T2 G2 T3 G3 T4 G4 T5 Our question: Can the gene list be grouped in a reasonable way using the functional information. Aim: help to find the heterogenous gene groups nested in the gene list G5 T6 G6 T7 G7 T8 G8 T9 T10
Proposed method • Cluster the gene list using ontological data with Non-negative Matrix factorization (NMF) • -shown to perform well on sparse binary matrices • -note that the clustering is only based on the functional annotations • -no expression data or sequence similarity is used • Vary the used cluster number and highlight the features that stay similar although the number of clusters changes • present the most over-represented classes for each cluster
Obtained graphical output analyzed list was yeast genes that were important for the growth of yeast in H2O2 stress (Thorpe, PNAS, 2004) Lines present binary correlation (0, no correlation, 1, clusters match exactly) Each cluster shows functional classes that were over-represented in the original gene list and which are over-represented in the created cluster. More details will be shown for this clustering
Competing methods:sorted class list Sorted class list gives an impression that the list includes only mitochondrial ribosome proteins