Download
1 / 41
410 likes | 479 Vues
Dive into the world of radioactive decay in geology, from isotopic masses to dating methods. Learn about decay types, decay chains, mass spectrometry, and geochronology.

E N D
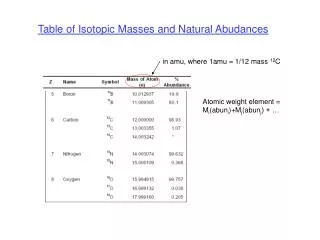
Table of Isotopic Masses and Natural Abudances in amu, where 1amu = 1/12 mass 12C Atomic weight element = Mi(abuni)+Mj(abunj) + …
Four types of radioactive decay 1) alpha (a) decay - 4He nucleus (2p + 2n) ejected 2) beta () decay - change of nucleus charge, conserves mass 3) gamma (g) decay - photon emission, no change in A or Z 4) spontaneous fission - for Z=92 and above, generates two smaller nuclei
Spontaneous fission - heavy nuclides split into two daughters and neutrons - U most common (fission-track dating) Fission tracks from 238U fission in old zircon
234Th 24d Decay chains - three heavy elements feed large decay chains, where decay continues through radioactive daughters until a stable isotope is reached 238U --> radioactive daughters --> 206Pb Also 235U (t1/2) = 700 Ma And 232Th (t1/2) =10 Ga
Counting Statistics and Error Estimation Radioactive decay process behaves according to binomial statistics. For large number of decays, binomial statistics approach a perfect Guassian. Ex: 100 students measure 14C disintegrations in 1g of modern coral (A = 13.56 dpm) with perfect geiger counters, for 10 minutes 1s=68.3% 2s=95% 3s=99% N+2sqrt(N) N+3sqrt(N) N+sqrt(N) N-3sqrt(N) N-2sqrt(N) N-sqrt(N) Number of Observations Expected value (N) 124.0 135.6 147.2 Observed # disintegrations Since the students only counted 135.6 disintegrations, they will only achieve a 1s accuracy of ±sqrt(135.6)=±11.6 disintegrations …. Or in relative terms, 11.6d/135.6d = 8.5% In other words, your 1srelative error (in %) will be equal to (1/(sqrt(total counts)))*100
Introduction to Mass Spectrometry Sample introduction Count ions Separate masses Collect results Ionization Minimize collisions, interferences Nier-type mass spec
Various isotopic systems start ticking the clock at different temperatures. Above these temperatures, parent and/or daughter isotopes move freely in and out of the system
Example K (radioactive parent) - Ar (daughter) K Ar At T’s above a certain # (say, Tc), all or some Ar atoms are lost from the system considered the “chronometer”.
Example K (radioactive parent) - Ar (daughter) K Ar When T is < than Tc, all Ar atoms remain within the system considered the “chronometer”, e.g. a K-spar grain.
Closure temperature To a first approximation, there is one temperature below which diffusion is so slow that radiogenic parent or daughter atoms become static. The corollary is that every age we measure with an isotopic system records the time elapsed since the temperature cooled below that value.
Stability of nuclei as a function of proton (Z) vs. neutron (N) numbers A (mass #)= Z+N
Isotope stability How many isotopes per element? The “stability” line is a thick one with some isotopes that are energetically stable and others that tend to “decay” into a different nuclear state.
The Chart of the Nuclides Isotopes of phosphorus Z (atomic number) N (neutron number)
Not all of these isotopes are stable as they depart from the idealized stability line. The isotopes that are not stable will tend to decay into more stable configurations. Let’s look at the element Rb and its various isotopes.
Essentially there are only two isotopes that don’t decay away within short time scales, 87Rb and 85Rb. All others are not present in nature. Of these, one is stable (85Rb), and one is radiogenic (87Rb)
How do we quantify stable or not? If isotopes decay away within laboratory time scales, that’s a no brainer - they are not stable. Slower decaying species - need to know their: Decay constant or Half life
Measuring radioactive decay Half life (t1/2) = the time required for half of the parent atoms to decay, alternatively use: The decay constant () = ln2/t1/2
What is geologically useful? Systems that have half lives comparable to or longer than the age of the planet. Fast decaying systems are evidently no good. E.g. 87Rb’s half life is ten times the age of the earth. Some super slow decaying systems have yet to be figured out. In the meantime, they count as “stable” isotopes.
Decay equation Law of decay- the rate of decay of an unstable parent is proportional to the number of atoms remaining at any time t. The proportionality constant is lambda — decay constant — units reciprocal of time. -dn = ln dt
The # of radiogenic daughter atoms formed (D*) is equal to the # of parent atoms consumed
Decay curve of a radionuclide and growth curve of its stable daughter in linear coordinates. Growth curve of daughter Decay curve of parent
K-Ar and 40Ar-39Ar Dating Hornblende thin section Many K-bearing minerals: biotite, muscovite, hornblende, K-feldspar, etc.
Closed vs. Open System Behavior The K-Ar age is only accurate if the sample has remained a CLOSED SYSTEM: i.e. there has been no gain or loss of K or Ar through time. In reality, this is almost never the case, because Ar is a noble gas and is highly mobile. You will get an inaccurate K-Ar age if: 1. Your initial Ar was not zero (the mantle contains appreciable 40Ar that may not have been completely degassed during rock formation). 2. You lose Ar because of low-temperature alteration. 3. Your sample is contaminated by atmospheric Ar (which is ~97% 40Ar). We can address #3 by monitoring 36Ar (~20,000 more abundant in air than in the mantle)
Step-wise heating and 40Ar-39Ar Dating Plot (40Ar*/39Ar) vs heating steps Or Plot Apparent Age vs. fraction 39Ar released vs
Step-wise heating and 40Ar-39Ar Dating Plot (40Ar*/39Ar) vs heating steps Or Plot Apparent Age vs. fraction 39Ar released “plateau” gives most reliable crystallization age higher T steps give consistent 40Ar*/39Ar ratios low-temperature steps reveal sample has lost 40Ar*
Laser applications in Ar-Ar dating Allows for step-wise heating of different zones within grains Lee et al., 1991 laser spot
U-Pb • U-Pb is a special system…Why? • There are two independent isotopic clocks ticking at the same time (actually three but two with U as a parent and Pb as daughter.
Multiple simultaneous decay sequences • Decay route t1/2, Ga Decay const., yr-1 • 238U — 206Pb 4.47 1.55125 x 10⁻¹⁰ • 235U — 207Pb 0.704 9.8485 x 10⁻¹⁰ • 232Th — 208Pb 14.01 0.49475 x 10⁻¹⁰
Equations Do not need parent/daughter ratios
When initial Pb is insignificant and lots of U available…. • Such as in zircon crystals • Things get even simpler/better: Two independent systems that should yield the same age
Concordia diagrams • Only U-Pb provides that kind of luxury of cross-checking ages