Download
1 / 15
150 likes | 412 Vues
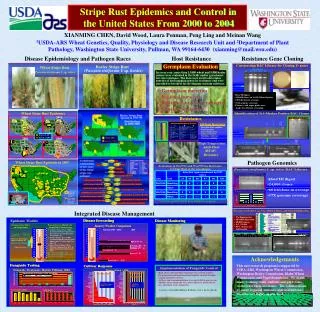
US Stripe Rust in 2006. Xianming Chen. USDA-ARS, Wheat Genetics, Quality, Physiology, and Disease Research Unit. Department of Plant Pathology, Washington State University. April 2, 2007. Wheat Stripe Rust. ( Puccinia striiformis f. sp. tritici ). Barley Stripe Rust.

E N D
US Stripe Rust in 2006 Xianming Chen USDA-ARS, Wheat Genetics, Quality, Physiology, and Disease Research Unit Department of Plant Pathology, Washington State University April 2, 2007
Wheat Stripe Rust (Puccinia striiformis f. sp. tritici)
Barley Stripe Rust (Puccinia striiformis f. sp. hordei)
Stripe rust occurred within the region. Places from which stripe rust were collected. Wheat Stripe Rust Epidemic in the US in 2005
Wheat Yield Losses Caused by Stripe Rust in 2005 US Total 3.36% 73.28 m (inpercentageandmillion bushels) 2.3 3.24 4.4 2.6 2.46 2.72 4.0 2.89 1.0 5.0 1.0 2.0 8.0 0.53 1.51 0.06 0.60 0.2 33.78 0.04 5.0 0.5 5.0 0.04 6.81 0.44 1.0 1.0 0.03 5.0 15.2 0.07 17.82 0.26 Http://www.crl.umn.edu
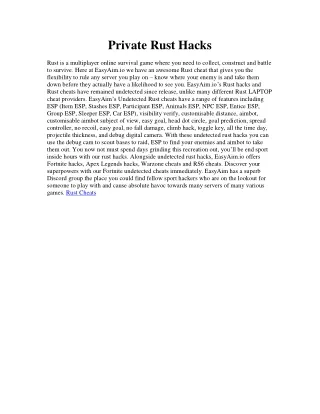
First Observations of Stripe Rust in Various States in 2006 5/31 5/23 Pullman 6/14 Kalispell Fargo Walla2 4/20 4/26 St. Paul 4/11 Corvallis 5/28 Weston 6/9 3/16 Logan 5/8 Wenetah 3/16 Urbana 6/1 Clarksville Colusa 6/5 5/16 Pleurina Painter 5/17 Hertford 4/17 5/13 Sturtgart 3/20 Limestone 4/23 Yuma College Station 3/20 3/7 Plains Baton Rouge
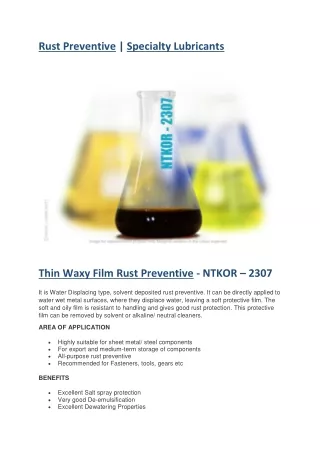
1995 1993 1995 1993 1994 1992 1994 1992 1993 1992 1991 ND WA MT ND ND WA WA MT MT MN MN MN ME ME ME WI SD VT ID WI WI SD SD VT VT OR MI ID ID NH OR OR MI MI WY NH NH WY WY NY MA NY NY IA MA MA NE CT IA IA NE NE CT CT PA PA PA OH NJ IN IL OH OH NV NJ NJ IN IN IL IL MD NV NV UT MD MD CO UT UT CO CO DE MO WV KS DE DE MO MO WV WV KS KS KY VA KY KY VA VA CA OK TN NC OK OK TN TN NC NC NC NC NC AR AZ NM AR AR AZ AZ NM NM SC SC SC AL MS AL AL GA MS MS GA GA TX TX TX LA LA LA FL 2003 - 2006 2000 2001 FL ND WA MT MN ME WI SD VT ID OR MI NH WY NY MA IA NE CT PA OH NJ IN IL NV MD UT CO DE MO WV KS KY VA Trace – 20% CA OK TN NC NC AR AZ NM SC AL MS GA TX LA Severe (>20%) FL 2002 Barley Stripe Rust - Spread in 1991 1995 Distributions in 2000 - 06
Yield Losses Caused by Stripe Rust in the US in 2006 Crop State Percent Bushels Winter wheat Arkansas 1.0 189,800 Winter wheat California 15.0 2,529,100 Durum wheat 3.0 199,000 Winter wheat Idaho 0.3 164,500 Spring wheat 0.5 172,400 Winter wheat Louisiana 2.0 114,700 Winter wheat Montana 0.6 498,400 Spring wheat 0.1 63,900 Winter wheat Oregon 0.2 77,500 Spring wheat 0.5 28,900 Winter wheat Washington 0.2 238,100 Spring wheat 0.5 106,800 All wheat US Total 0.24 4,383,100 Barley 0.05 93,800 http://www.cdl.umn.edu/index.htm
Barley differentials No. Cultivar 1 Topper 2 Heils Franken 3 Emir 4 Astrix 5 Hiproly 6 Varunda 7 Abed Binder 12 8 Trumpf 9 Mazurka 10 Bigo 11 I 5 12 Bancroft Barley Stripe Rust Races in 2006 Frequency (%) PSH Race Virulence US CA WA OR AZ MN 1 1,2 2.3 6.3 6.3 36 1,4 2.3 12.5 48 1 4.7 52 1,5,7,8 2.3 6.3 56 1,5,7,8,12 4.7 20.0 25.0 10.0 60 1,5,7,8,9,10,12 7.0 6.3 10.0 63 1,3,5,7,8,12 2.3 31.3 75.0 71 1,3,5,6,7,8,9,10,12 25.6 30.0 72 1,2,3,4,5,6,7,8,9,10,11,12 2.3 83.3 75 1,2,3,4,5,6,7,8,9,10,12 27.9 20.0 18.8 76 1,5,6,7,8,9,10,12 7.0 6.3 77 1,3,5,7,8,9,10,12 2.3 12.5 78 1,2,4,5,6,7,8,12 2.3 8.3 79 1,2,4,5,7,8,9,10,12 2.3 10.0 6.3 80 1,5,7,10 2.3 100 81 1,7,10 2.3
Races of Puccinia striiformis f. sp. hordei in Various States in 2006 No. of No. of State Isolate Races PSH Race (and No. of Isolates) Arizona 12 3 72 (1), 75 (10), 78 (1) California 16 9 36 (1), 48 (2), 52 (1), 60 (1), 71 (5), 76 (3), 77 (1), 80 (1) Oregon 4 2 60 (1), 71 (3) Washington 10 7 56 (2), 60 (1), 63 (1), 71 (1) 75 (2), 76 (3), 79 (1) Minnesota 1 1 81 (1)* Total 43 16 * This isolate from barley also was identified as PST-123 .
Wheat Differentials for PST races No Name No Name 1 Lemhi 11 Lee 2 Chinese 166 12 Fielder 3 Heines VII 13 Tyee 4 Moro 14 Tres 5 Paha 15 Hyak 6 Druchamp 16 Express 7 Yr5 17 Yr8 8 Produra 18 Yr9 9 Yamhill 19 Clement 10 Stephens 20 Compair Wheat Stripe Rust Races Identified in 2006 PST No. of Collected Virulences race samples from 25 1,3,6,8,9,10,12 3 WA 35 1,10 5 WA 78 1,3,11,12,16,17,18,19,20 1 WA 80 1,3,8,11,12,16,17,18,19,20 1 GA 98 1,3,8,10,11,12,16,17,18,19,20 2 LA,TX 100 1,3,8,9,10,11,12,16,17,18,19,20 42 16 states 101 1,2,3,8,9,10,11,12,16,17,18,19,20 24 CA (23), WA (1) 102 1,3,8,9,10,11,12,14,16,17,18,19,20 17 11 states 111 1,3,5,8,9,10,11,12,16,17,18,19,20 5 OR, ID, WA 114 1,3,4,8,9,10,11,12,14,16,17,18,19,20 29 OR, ID, WA, UT 115 1,3,5,8,9,10,11,12,16,17,18,19,20 7 OR, ID, WA 116 1,3,4,5,8,9,10,11,12,16,17,18,19,20 1 WA 117 1,3,6,8,9,10,11,12,14,16,17,18,19,20 1 OR, WA 122 1,2,3,6,8,9,10,11,12,14,16,17,18,19,20 1 CA 123 1,3,6,8,9,10,11,12,16,17,18,19,20 2 CA, MN 124 1,2,3,12 1 CA 125 1,2,8,12 1 CA 126 1,2,8,10,12,16 1 CA
No. of No. of State isolates races PST race (and frequncy, %) CA 28 4 101 (82.1) 100 (7.1), , 102 (7.1), 122 (3.6) OR 14 6 114 (28.6) 100 (21.4), 102 (21.4), 111 (7.1), , 115 (7.1), 117 (14.3) 25 (5.8), 35 (9.6), 78 (1.9), 100 (13.5),101 (3.8),102 (1.9),111 (5.8), WA 52 11 114 (38.5) , 115 (7.7), 116 (1.9), 117 (9.6) ID 10 4 114 (40.0) 100 (30.0), 111 (10.0), , 115 (20) UT 5 2 100 (80.0) , 114 (20.0) MT 3 2 100 (33.3), 102 (66.7) AL 1 1 100 AR 1 1 102 GA 11 3 100 (72.7) 80 (9.1), , 102 (18.2) IL 1 1 100 (1) IN 3 2 102 (66.7) 100 (33.3), LA 4 3 100 (50.0) 98 (25.0), , 102 (25.0) MD 2 2 100 (50.0), 102 (50.0) MN 4 3 100 (50.0) , 102 (25.0), 123 (25.0) MO 1 1 102 NC 1 1 100 TX 1 1 98 VA 5 1 100 (100.0) Total 147 18 PST Races and Their Frequencies in Various States in 2006
Race Identification of Wheat Stripe Rust in 2006 Number (frequency, %) US WA No. of samples 147 52 Total no. of races 18 11 No. of previous races 13 (96.5) 11 (21.2) No. of new races 5 (3.5) 0 (0) Races in old group 2 (5.6) 2 (15.4) Races in new group 16 (94.4) 9 (84.6) Predominant races PST-100 (29.4) (13.5) PST-114 (20.3) (38.5) PST-101 (16.8) (3.8) PST-102 (11.9) (1.9) PST-115 (4.9) (7.7) PST-111 (3.5) (5.8)
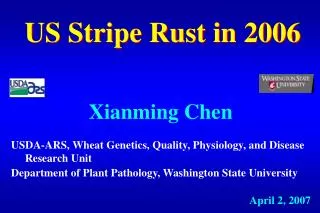
Prevalent races 1st 80 (12%) 78 (23%) 78 (31%) 100 (33%) 100 (50%) 100 (33%) 100 (29%) 2nd 20 (11%) 80 (17%) 97 (11%) 98 (29%) 102 (17%) 102 (27%) 114 (20%) 3rd 59 (11%) 67 (8%) 98 (10%) 97 (11%) 101 (4%) 115 (14%) 101 (17%) 58 (11%) 71 (5%) 114 (3.2%) 102 (12%) 4th 80 (9%) 78 (6%) 92 (3%) 78 (8%) 64 (4%) 116 (3%) 115 (5%) 5th 20 (5%) 80 (5%) 110 (3%) Summary of Races of Puccinia striiformis f. sp. tritici in the US from 2000 to 2006 2003 2004 2006 2000 2001 2002 2005 No. of isolates 184 414 420 293 486 143 156 No. of races 42 34 39 31 28 27 18 No. of new races 21 10 9 10 6 6 5
Acknowledgements K. Burch D. Hole R. McIntosh M. Wang J. Windes C. Cowger L Jackson S. Markell J. Costa Y. Jin D. Wood L. Penman M. Carson K. Richardson J. Youmans M. Johnston C. Griffey M. Kolding D. Santra R. Harrington L. Kolb B. Steffenson A. Steve S. Harrison D. Long