Significance Testing
Significance Testing. 10/22/2013. Readings. Chapter 3 Proposing Explanations, Framing Hypotheses, and Making Comparisons (Pollock) (pp. 58-76) Chapter 5 Making Controlled Comparisons (Pollock) Chapter 4 Making Comparisons (Pollock Workbook) . Opportunities to discuss course content.

Significance Testing
E N D
Presentation Transcript
Significance Testing 10/22/2013
Readings • Chapter 3 Proposing Explanations, Framing Hypotheses, and Making Comparisons (Pollock) (pp. 58-76) • Chapter 5 Making Controlled Comparisons (Pollock) • Chapter 4 Making Comparisons (Pollock Workbook)
Office Hours For the Week • When • Wednesday 10-12 • Thursday 8-12 • And by appointment
Course Learning Objectives • Students will be able to interpret and explain empirical data. • Students will achieve competency in conducting statistical data analysis using the SPSS software program.
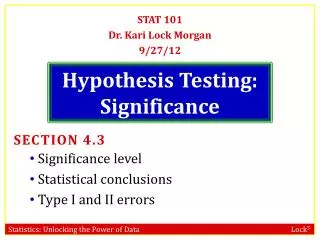
Why Hypothesis Testing • To determine whether a relationship exists between two variablesand did not arise by chance. (Statistical Significance) • To measure the strength of the relationship between an independent and a dependent variable? (association)
Testing a hypothesis • Before we can test it, we have to state it • The Null Hypothesis- There is no relationship between my independent and dependent variable • The Alternate Hypothesis • We are testing for Significance: We are trying to disprove the null hypothesis and find it false!
The Alternate Hypothesis • Also called the research hypothesis • State it clearly • State an expected direction
After testing, the Null is either • True-no relationship between the groups, in which case the alternate hypothesis is false---- Nothing is going on (except by chance)! • False- there is a relationship and the alternative hypothesis is correct-- something is going on (statistically)!
P-values or Alpha levels • p<.05 (95% confidence level) - There is less than a 5% chance that we will be wrong. • p<.01. (99% confidence level) 1% chance of being wrong • p<.001 (99.9 confidence level) 1 in 1000 chance of being wrong
A test of statistical significance Chi-square
What is Chi-Square? • A test of significance between two categorical variables • We run the test in conjunction with cross-tabs
Things about Chi-Square • It is not a test of strength, just significance • Chi-square is inflated by large samples • It is a test that tries to disprove the null hypothesis. • An insignificant chi-square means that no relationship exists.
How to tell a relationship • For a chi square value to be significant, there has to be a lot of variation in the table! • We want to see the unexpected. We want patterns
Chi-Square is an up or down measure • if our Chi-Square significance value from our test is greater than .05 we accept the null hypothesis and we have no relationship • If our significance value is less than or equal to.05 table, we reject the null hypothesis- we have a relationship
An Example • Gun Ownership and Confidence in Congress • Null Hypothesis- There is no relationship between gun ownership and Confidence in Congress • Alternate Hypothesis- Gun owners are less trusting of Congress than non-gun owners.
Chi-Square in SPSS Is this value less than .05? • Pearson-Chi Square • Value (bigger is more likely to be significant) • D.F. (Degrees of freedom, the size of the table) • Asymp. Sig (2-sided) This is the column that matters! • Accept or Reject the Null?
Role of Women and Marital Status • Null- There is no relationship between marital status and beliefs on the role of women • Alternate- Married people will be more likely to say female role at home. Accept or Reject the Null?
Global Warming Policy and Views on the Tea Party (2010) Accept or Reject the Null?
An Easy One • Dataset- NES 2008 • DV= Who08 • IV= Race • Null- There is no relationship between Race and Vote in 2008 • Alternate- African Americans are More likely to Vote for Obama
First Run A Cross Tab Click on Statistics Click on Chi-Square
The Results • What does the Chi-Square Tell us? • What is the Asymp. Sig here? • What do We Do with the null hypothesis? • What is the Practical Significance here?
Hard-Line Immigration Policy • D.V. Immigration Policy • I.V. Hispanic (dichotomous)
The Results • What does the Chi-Square Tell us? • What is the Asymp. Sig here? • What do We Do with the null hypothesis? • What is the Practical Significance here?
Nominal Variables Measures of Association
Why Measures of Association • Chi-Square only tests for significance • It does not say how strongly the variables are related • We Use a Measure of Association to Do this
A measure of association is a single number that reflects the strength of the relationship
Measures of association for Nominal Variables tell us: • Strength of the Relationship • The statistical significance of the relationship • These go hand in hand
A value of 1.00 means a perfect relationship, a value of .000 means no relationship
Lambda • What kinds of variables are needed for Lambda? • Lambda ranges from 0 (no relation) to 1 (a perfect relationship) • It measures how much better one can predict the value of each case on the DV if one knows the value of the IV
Interpreting Lambda • .000 to .10 none • .10-.20 weak • .20-.30 moderate • .30-.40 strong • .40 and above- there is a very strong relationship
Reading Lambda in SPSS • IN SPSS, LAMBDA GIVES YOU 3 DIFFERENT VALUES • Symmetric- always ignore • Two measures of your dependent variable • always use the lambda associated with your dependent variable. • If you place the dependent variable as the ROW VARIABLE, this will be the middle value. • Help from Rocky IV- And the video
The one in the middle Ignore these The significance of the Lambda
Lambda as a PRE Measure • Proportional Reduction in Error (PRE) • this is defined as the improvement, expressed as a Percentage, in predicting a dependent variable due to knowledge of the independent variable. • How well we can increase our prediction of the dependent variable by knowing the independent variable?
Converting a Lambda to a Percent • We take the value of our association measure • Multiply by 100% • this is our PRE value.