Download
1 / 28
280 likes | 481 Vues
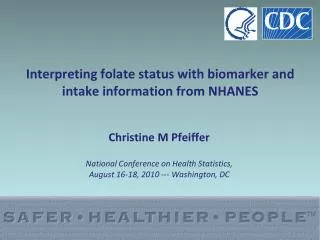
Interpreting folate status with biomarker and intake information from NHANES. Christine M Pfeiffer National Conference on Health Statistics, August 16-18, 2010 --- Washington, DC. Presentation outline. Tools available in NHANES for nutritional status assessment

E N D
Interpreting folate status with biomarker and intake information from NHANES Christine M Pfeiffer National Conference on Health Statistics, August 16-18, 2010 --- Washington, DC
Presentation outline • Tools available in NHANES for nutritional status assessment • Folate fortification policy • Interpreting folate status using biomarkers and dietary intake information from NHANES • Strengths and weaknesses or challenges • Lessons learned and way forward
US NHANES Cross-sectional nationally representative survey • Conducted by the National Center for Health Statistics, CDC • Designed to collect information about the health and diet of people in the United States • Unique in that it combines a home interview with tests that are done in a Mobile Examination Center
Dietary intake interview component of NHANES, conducted as partnership between USDA and DHHS • Replacing the previous USDA Continuing Survey of Food Intakes by Individuals (CSFII) • Intake of nutrients from foods estimated using the most current USDA Food and Nutrient Databases for Dietary Studies (FNDDS)
National Report on Biochemical Indicators of Diet and Nutrition in the U. S. Population 1999-2002 www.cdc.gov/nutritionreport
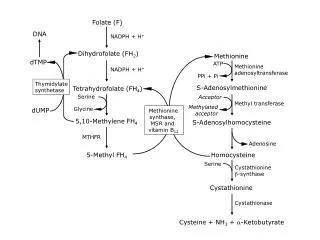
Introduction of folic acid fortification Dietary intake: low (foods & supplements) NTD surveillance: Folate-preventable NTD’s Biomarker data: Prevalence of deficiency high Alternative strategies to increase intake Need for folic acid fortification policy Benefits Risks Folic acid fortification amount determined through modeling Frequency and amounts of target foods consumed by population groups Identification of target foods for fortification Intervention trials providing dose-response information Feinleib M et al. Folate fortification for the prevention of birth defects: case study. Am J Epidemiol 2001
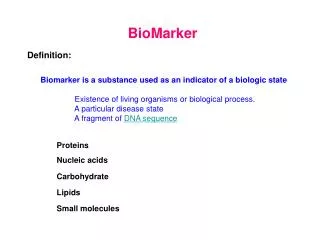
Association of folate with health outcomes • NTD’s and other birth defects • Cardiovascular disease • Cognition • Cancer • Acceleration of cancerous growth • Masking of vitamin B12 deficiency • Twinning • Immunity • Epigenetic changes Proven effectiveness of folic acid intervention Cause and effect has not been proven Potential adverse effects; basis is observational data
Monitoring of the impact of folic acid fortification Changes in blood levels Changes in dietary intake Folic acid fortification policy Benefits Risks Changes in other health outcomes Changes in NTD rates anes
Changes in biomarker levels of folate status How much did folate blood levels change after the introduction of fortification? What are the challenges associated with assessing folate status through biochemical measurements?
Serum folate levels have nearly tripled • Serum folate levels have increased much more than expected from FDA intake modeling and short-term FA supplementation trials – demonstrating the value of biomonitoring. • Post-fortification serum folate levels have stabilized after several years. http://www.cdc.gov/nutritionreport http://www.cdc.gov/nchs/data/databriefs/db06.htm
Prevalence of low RBC folate levels has decreased Red blood cell folate levels have also stabilized after fortification and the prevalence of low levels in women of childbearing age was ~5% compared to ~40% at pre-fortification. RBC folate <140 ng/mL http://www.cdc.gov/nchs/data/databriefs/db06.htm
Strengths of folate biomarker data • Good reflection of nutritional status; low levels have been linked to functional outcomes (NTD’s) • The same assay (Bio-Rad RIA) was used from NHANES III to NHANES 2005-2006 to measure serum and RBC folate levels • Excellent assay precision; small fluctuations over time can be detected • Assay performance was stable over time; changes in population levels could be interpreted unequivocally
Challenges of folate biomarker data • Collection of blood is invasive; lab analyses are expensive • Lack of folate assay standardization • Cutoff values of deficiency are method dependent • Difficulty comparing data between methods and countries • Switch to new assay (microbiological assay) in 2007; requires cross-over data
Changes in folate dietary intake How much did folate intake change after the introduction of fortification? What are the challenges associated with assessing dietary intake of folate?
Changes in folate dietary intake • NHANES 1988-1994 versus 1999-2000, entire population: • After fortification, the category “bread, rolls, and crackers” became the single largest contributor of total folate to the American diet (15.6% of total intake), surpassing vegetables, which were the number one folate food source prior to fortification. • The mean dietary total folate intake of the population increased by 76 μg/d (28%), from 275 μg/d to 351 μg/d. • Caveat:The dietary folate data in the NHANES nutrient database are reported as total folate intake (food folate + folic acid from fortification) in μg/day, not as DFE, which takes the higher bioavailability of folic acid compared to food folate into account (1 DFE = 1 μg food folate = 0.6 μg folic acid from fortified food). Dietrich M et al. J Am Coll Nutr 2005
Post-fortification total folic acid intake • NHANES 2001-2002, women of childbearing age: • Neither race/ethnic group consumed the recommended 400 μg of folic acid daily from fortified food and/or supplements. • The average estimated daily total folic acid intake was 221 μg Caveat: Underestimation by ~10% - no second 24-h dietary recall. Yang Q-H et al. AJCN 2007
Post-fortification total folate and folic acid intake • NHANES 2003-2006, entire population: • 14-19% of women and 5.2-9.2% of men had a folate intake below the EAR (320 μg/day of DFEs). • For those consuming high amounts of folic acid, the folic acid comes from dietary supplements, not from fortified foods Bailey RL et al. AJCN 2010
Post-fortification folic acid source, usual intake and UL • NHANES 2003-2006, entire population: • Of the total US adult population, 2.7% exceeded the UL for folic acid (1,000 μg/day of folate from fortified food or as a supplement, exclusive of food folate). A B C D ECGP = enriched cereal grain products RTE = ready-to-eat cereals SUP = dietary supplements Yang Q-H et al. AJCN 2010
Summary - US folic acid fortification intervention • Biomarker levels have responded as expected: • Right direction • But, much bigger magnitude • Dietary intake levels have also responded as expected: • Right direction • But, folate intake is still below the EAR for a small portion of the population • Women of childbearing age still don’t consume on average the recommended 400 μg of folic acid daily • Only a small fraction of those who consume supplements exceed the UL of folic acid Which data tell us the truth?
Requirements for nutritional biomarkers in population-based surveys • Precision of assay to enable detection of small trends • Robustness of assay to ensure comparability of data over time • Continuity of same assay over time, when possible • If assay changes occur, need cross-over study to enable data comparison over time • Testing laboratory: • Internal quality control and regular assay verifications • External quality assurance • Reference materials • Global community: • Assay standardization
Data requirements to formulate and evaluate nutrition policy • Nutritional biomarker data (multiple biomarkers where possible) • Dietary intake data (usual intakes) • Supplement usage information • Demographic characteristics • Behavioral factors • Health indicators • Coverage of various population groups • Monitoring over multiple years
WAY FORWARD • NIH/ODS and NCHS sponsored roundtable on folate and vitamin B12 issues in NHANES in July 2010 • Future methodology to monitor serum folatelevels should be LC-MS/MS • Highly specific higher-order reference methodology • Allows monitoring of free folic acid in addition to total folate • If possible, microbiological assay should be continued to monitor RBC folate levels (at least in women of childbearing age) anes
Acknowledgments • Donna LaVoie – Bio-Rad RIA • Mindy Zhang – Microbiological assay • Zia Fazili – LC-MS/MS • Colleagues at NCHS • Colleagues at NCBDDD • Colleagues at NIH/ODS • Colleagues at FDA Nutritional Biomarkers Branch
Folate intake recommendations • RDA (Recommended Dietary Allowance) for both men and women is 400 μg/day of DFEs (dietary folate equivalents) • EAR (Estimated Average Requirement) for both men and women is 320 μg/day of DFEs • To reduce the risk of NTDs for women capable of becoming pregnant, the recommendation is to take 400 μg folic acid daily from fortified foods, supplements, or both in addition to consuming food folate from a varied diet • UL (Tolerable Upper Intake Level) for adults is set at 1,000 μg/day of folate from fortified food or as a supplement, exclusive of food folate Institute of Medicine, Food and Nutrition Board. Dietary reference intakes: Thiamin, riboflavin, niacin, vitamin B6, folate, vitamin B12, pantothenic acid, biotin, and choline. Washington, D.C.: National Academy Press; 1998.